BP 2013 Annual Report Download - page 177
Download and view the complete annual report
Please find page 177 of the 2013 BP annual report below. You can navigate through the pages in the report by either clicking on the pages listed below, or by using the keyword search tool below to find specific information within the annual report.-
 1
1 -
2
-
3
-
4
-
5
-
6
-
7
-
8
-
9
-
10
-
11
-
12
-
13
-
14
-
15
-
16
-
17
-
18
-
19
-
20
-
21
-
22
-
23
-
24
-
25
-
26
-
27
-
28
-
29
-
30
-
31
-
32
-
33
-
34
-
35
-
36
-
37
-
38
-
39
-
40
-
41
-
42
-
43
-
44
-
45
-
46
-
47
-
48
-
49
-
50
-
51
-
52
-
53
-
54
-
55
-
56
-
57
-
58
-
59
-
60
-
61
-
62
-
63
-
64
-
65
-
66
-
67
-
68
-
69
-
70
-
71
-
72
-
73
-
74
-
75
-
76
-
77
-
78
-
79
-
80
-
81
-
82
-
83
-
84
-
85
-
86
-
87
-
88
-
89
-
90
-
91
-
92
-
93
-
94
-
95
-
96
-
97
-
98
-
99
-
100
-
101
-
102
-
103
-
104
-
105
-
106
-
107
-
108
-
109
-
110
-
111
-
112
-
113
-
114
-
115
-
116
-
117
-
118
-
119
-
120
-
121
-
122
-
123
-
124
-
125
-
126
-
127
-
128
-
129
-
130
-
131
-
132
-
133
-
134
-
135
-
136
-
137
-
138
-
139
-
140
-
141
-
142
-
143
-
144
-
145
-
146
-
147
-
148
-
149
-
150
-
151
-
152
-
153
-
154
-
155
-
156
-
157
-
158
-
159
-
160
-
161
-
162
-
163
-
164
-
165
-
166
-
 167
167 -
 168
168 -
 169
169 -
 170
170 -
 171
171 -
 172
172 -
 173
173 -
 174
174 -
 175
175 -
 176
176 -
 177
177 -
 178
178 -
 179
179 -
 180
180 -
 181
181 -
 182
182 -
 183
183 -
 184
184 -
 185
185 -
 186
186 -
 187
187 -
188
-
189
-
190
-
191
-
192
-
193
-
194
-
195
-
196
-
197
-
198
-
199
-
200
-
201
-
202
-
203
-
204
-
205
-
206
-
207
-
208
-
209
-
210
-
211
-
212
-
213
-
214
-
215
-
216
-
217
-
218
-
219
-
220
-
221
-
222
-
223
-
224
-
225
-
226
-
227
-
228
-
229
-
230
-
231
-
232
-
233
-
234
-
235
-
236
-
237
-
238
-
239
-
240
-
241
-
242
-
243
-
244
-
245
-
246
-
247
-
248
-
249
-
250
-
251
-
252
-
253
-
254
-
255
-
256
-
257
-
258
-
259
-
260
-
261
-
262
-
263
-
264
-
265
-
266
-
267
-
268
-
269
-
270
-
271
-
272
-
273
-
274
-
275
-
276
-
277
-
278
-
279
-
280
-
281
-
282
-
283
-
284
-
285
-
286
-
287
-
288
 |
 |

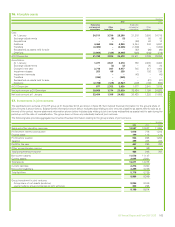
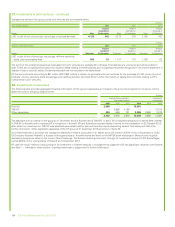
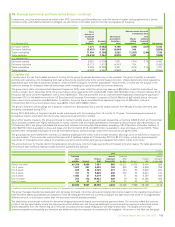
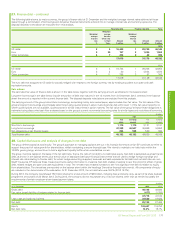
26. Derivative financial instruments – continued
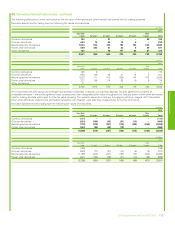
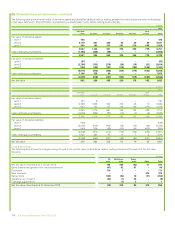
The following tables show further information on the fair value of derivatives and other financial instruments held for trading purposes.
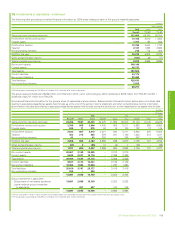
Derivative assets held for trading have the following fair values and maturities.
$ million
2013
Less than
1 year 1-2 years 2-3 years 3-4 years 4-5 years
Over
5 years Total
Currency derivatives 143 – 21 – – 28 192
Oil price derivatives 694 78 23 13 2 – 810
Natural gas price derivatives 1,034 526 334 192 154 600 2,840
Power price derivatives 528 202 81 22 8 30 871
Other derivatives 102 – 93 147 66 67 475
2,501 806 552 374 230 725 5,188
$ million
2012
Less than
1 year 1-2 years 2-3 years 3-4 years 4-5 years
Over
5 years Total
Currency derivatives 169 6 ––––175
Oil price derivatives 656 109 38 21 12 5 841
Natural gas price derivatives 1,532 711 418 259 144 472 3,536
Power price derivatives 327 188 114 62 19 9 719
Other derivatives 71 –––––71
2,755 1,014 570 342 175 486 5,342
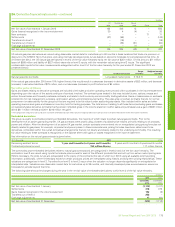
At 31 December 2013 the group had contingent consideration receivable in respect of a business disposal. The sale agreement contained an
embedded derivative – the whole agreement has, consequently, been designated at fair value through profit or loss and shown within other derivatives
held for trading, and falls within level 3 of the fair value hierarchy. The valuation depends on refinery throughput and future margins. At 31 December
2012, other derivatives related to the anticipated transaction with Rosneft – see Cash flow hedges below for further information.
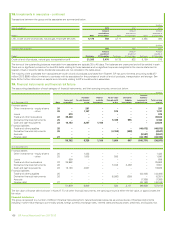
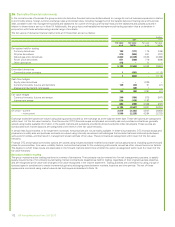
Derivative liabilities held for trading have the following fair values and maturities.
$ million
2013
Less than
1 year 1-2 years 2-3 years 3-4 years 4-5 years
Over
5 years Total
Currency derivatives (111) –––––(111)
Oil price derivatives (620) (100) (42) (31) (13) – (806)
Natural gas price derivatives (778) (319) (157) (110) (102) (563) (2,029)
Power price derivatives (400) (99) (48) (13) – – (560)
(1,909) (518) (247) (154) (115) (563) (3,506)
$ million
2012
Less than
1 year 1-2 years 2-3 years 3-4 years 4-5 years
Over
5 years Total
Currency derivatives (189) –––––(189)
Oil price derivatives (580) (77) (27) (12) (8) (3) (707)
Natural gas price derivatives (1,199) (440) (241) (135) (78) (403) (2,496)
Power price derivatives (341) (133) (59) (21) (10) (25) (589)
(2,309) (650) (327) (168) (96) (431) (3,981)
Financial statements
BP Annual Report and Form 20-F 2013 173