BP 2013 Annual Report Download - page 108
Download and view the complete annual report
Please find page 108 of the 2013 BP annual report below. You can navigate through the pages in the report by either clicking on the pages listed below, or by using the keyword search tool below to find specific information within the annual report.-
 1
1 -
2
-
3
-
4
-
5
-
6
-
7
-
8
-
9
-
10
-
11
-
12
-
13
-
14
-
15
-
16
-
17
-
18
-
19
-
20
-
21
-
22
-
23
-
24
-
25
-
26
-
27
-
28
-
29
-
30
-
31
-
32
-
33
-
34
-
35
-
36
-
37
-
38
-
39
-
40
-
41
-
42
-
43
-
44
-
45
-
46
-
47
-
48
-
49
-
50
-
51
-
52
-
53
-
54
-
55
-
56
-
57
-
58
-
59
-
60
-
61
-
62
-
63
-
64
-
65
-
66
-
67
-
68
-
69
-
70
-
71
-
72
-
73
-
74
-
75
-
76
-
77
-
78
-
79
-
80
-
81
-
82
-
83
-
84
-
85
-
86
-
87
-
88
-
89
-
90
-
91
-
92
-
93
-
94
-
95
-
96
-
97
-
 98
98 -
 99
99 -
 100
100 -
 101
101 -
 102
102 -
 103
103 -
 104
104 -
 105
105 -
 106
106 -
 107
107 -
 108
108 -
 109
109 -
 110
110 -
 111
111 -
 112
112 -
 113
113 -
 114
114 -
 115
115 -
 116
116 -
 117
117 -
 118
118 -
119
-
120
-
121
-
122
-
123
-
124
-
125
-
126
-
127
-
128
-
129
-
130
-
131
-
132
-
133
-
134
-
135
-
136
-
137
-
138
-
139
-
140
-
141
-
142
-
143
-
144
-
145
-
146
-
147
-
148
-
149
-
150
-
151
-
152
-
153
-
154
-
155
-
156
-
157
-
158
-
159
-
160
-
161
-
162
-
163
-
164
-
165
-
166
-
167
-
168
-
169
-
170
-
171
-
172
-
173
-
174
-
175
-
176
-
177
-
178
-
179
-
180
-
181
-
182
-
183
-
184
-
185
-
186
-
187
-
188
-
189
-
190
-
191
-
192
-
193
-
194
-
195
-
196
-
197
-
198
-
199
-
200
-
201
-
202
-
203
-
204
-
205
-
206
-
207
-
208
-
209
-
210
-
211
-
212
-
213
-
214
-
215
-
216
-
217
-
218
-
219
-
220
-
221
-
222
-
223
-
224
-
225
-
226
-
227
-
228
-
229
-
230
-
231
-
232
-
233
-
234
-
235
-
236
-
237
-
238
-
239
-
240
-
241
-
242
-
243
-
244
-
245
-
246
-
247
-
248
-
249
-
250
-
251
-
252
-
253
-
254
-
255
-
256
-
257
-
258
-
259
-
260
-
261
-
262
-
263
-
264
-
265
-
266
-
267
-
268
-
269
-
270
-
271
-
272
-
273
-
274
-
275
-
276
-
277
-
278
-
279
-
280
-
281
-
282
-
283
-
284
-
285
-
286
-
287
-
288
 |
 |

BP Annual Report and Form 20-F 2013104
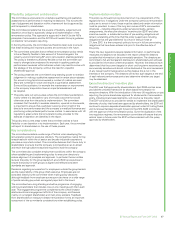
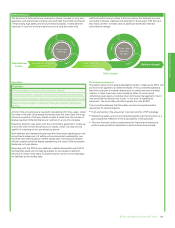
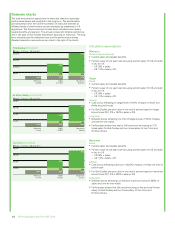
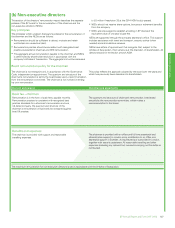
Scenario charts
The total remuneration opportunity for executive directors is strongly
performance based and weighted to the long term. The charts below
provide scenarios for the total remuneration of executive directors at
different levels of performance and are calculated as prescribed in UK
regulations. The fixed component in each chart includes current salary,
taxable benefits and pension. The annual component reflects cash bonus,
and in the case of Bob Dudley the pension accruing on his bonus. The long
term includes both the deferred bonus and the performance shares.
Detailed calculation assumptions are noted to the right of the charts.
$20,000
$15,000
$10,000
$5,000
Annual Long term
Fixed
Minimum
$2,358
Target
$11,610
Maximum
$20,061
Bob Dudley ($ thousand)
12%
20%
100%
12%
58%
22%
76%
£8,000
£6,000
£4,000
£2,000
Annual Long term
Fixed
Minimum
£1,004
Target
£3,844
Maximum
£6,506
Dr Brian Gilvary (£ thousand)
8%
76%
55%
19%
100% 26% 16%
£8,000
£6,000
£4,000
£2,000
Annual Long term
Fixed
Minimum
£1,104
Target
£4,200
Maximum
£7,102
Iain Conn (£ thousand)
8%
76%
55%
19%
16%
26%
100%
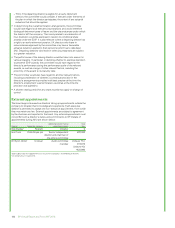
Calculation assumptions
Minimum
Fixed components only
• Current salary and taxable benefits.
• Pension value of one year’s service using current salary for US and cash
in lieu for UK.
– UK 35% x salary.
– US 1.3% x salary x 20.
Target
Fixed
• Current salary and taxable benefits.
• Pension value of one year’s service using current salary for US and cash
in lieu for UK.
– UK 35% x salary.
– US 1.3% x salary x 20.
Annual
• Cash bonus reflecting on-target level of 150% of salary of which two
thirds are paid in cash.
• For Bob Dudley, pension value of one year’s service based on target
bonus times 20 (1.3% x 150% x salary x 20).
Long term
• Deferred bonus reflecting one third of target bonus of 150% of salary
and one-for-one match.
• Performance shares that vest to half maximum amounting to 2.75
times salary for Bob Dudley and two times salary for Iain Conn and
Dr Brian Gilvary.
Maximum
Fixed
• Current salary and taxable benefits.
• Pension value of one year’s service using current salary for US and cash
in lieu for UK.
– UK 35% x salary.
– US 1.3% x salary x 20.
Annual
• Cash bonus reflecting maximum of 225% of salary of which one third is
paid in cash.
• For Bob Dudley, pension value of one year’s service based on maximum
bonus times 20 (1.3% x 225% x salary x 20).
Long term
• Deferred bonus reflecting two thirds of maximum bonus of 225% of
salary and one-for-one match.
• Performance shares that fully vest amounting to five and a half times
salary for Bob Dudley and four times salary for Iain Conn and
Dr Brian Gilvary.