BP 2013 Annual Report Download - page 183
Download and view the complete annual report
Please find page 183 of the 2013 BP annual report below. You can navigate through the pages in the report by either clicking on the pages listed below, or by using the keyword search tool below to find specific information within the annual report.-
 1
1 -
2
-
3
-
4
-
5
-
6
-
7
-
8
-
9
-
10
-
11
-
12
-
13
-
14
-
15
-
16
-
17
-
18
-
19
-
20
-
21
-
22
-
23
-
24
-
25
-
26
-
27
-
28
-
29
-
30
-
31
-
32
-
33
-
34
-
35
-
36
-
37
-
38
-
39
-
40
-
41
-
42
-
43
-
44
-
45
-
46
-
47
-
48
-
49
-
50
-
51
-
52
-
53
-
54
-
55
-
56
-
57
-
58
-
59
-
60
-
61
-
62
-
63
-
64
-
65
-
66
-
67
-
68
-
69
-
70
-
71
-
72
-
73
-
74
-
75
-
76
-
77
-
78
-
79
-
80
-
81
-
82
-
83
-
84
-
85
-
86
-
87
-
88
-
89
-
90
-
91
-
92
-
93
-
94
-
95
-
96
-
97
-
98
-
99
-
100
-
101
-
102
-
103
-
104
-
105
-
106
-
107
-
108
-
109
-
110
-
111
-
112
-
113
-
114
-
115
-
116
-
117
-
118
-
119
-
120
-
121
-
122
-
123
-
124
-
125
-
126
-
127
-
128
-
129
-
130
-
131
-
132
-
133
-
134
-
135
-
136
-
137
-
138
-
139
-
140
-
141
-
142
-
143
-
144
-
145
-
146
-
147
-
148
-
149
-
150
-
151
-
152
-
153
-
154
-
155
-
156
-
157
-
158
-
159
-
160
-
161
-
162
-
163
-
164
-
165
-
166
-
167
-
168
-
169
-
170
-
171
-
172
-
 173
173 -
 174
174 -
 175
175 -
 176
176 -
 177
177 -
 178
178 -
 179
179 -
 180
180 -
 181
181 -
 182
182 -
 183
183 -
 184
184 -
 185
185 -
 186
186 -
 187
187 -
 188
188 -
 189
189 -
 190
190 -
 191
191 -
 192
192 -
 193
193 -
194
-
195
-
196
-
197
-
198
-
199
-
200
-
201
-
202
-
203
-
204
-
205
-
206
-
207
-
208
-
209
-
210
-
211
-
212
-
213
-
214
-
215
-
216
-
217
-
218
-
219
-
220
-
221
-
222
-
223
-
224
-
225
-
226
-
227
-
228
-
229
-
230
-
231
-
232
-
233
-
234
-
235
-
236
-
237
-
238
-
239
-
240
-
241
-
242
-
243
-
244
-
245
-
246
-
247
-
248
-
249
-
250
-
251
-
252
-
253
-
254
-
255
-
256
-
257
-
258
-
259
-
260
-
261
-
262
-
263
-
264
-
265
-
266
-
267
-
268
-
269
-
270
-
271
-
272
-
273
-
274
-
275
-
276
-
277
-
278
-
279
-
280
-
281
-
282
-
283
-
284
-
285
-
286
-
287
-
288
 |
 |

30. Pensions and other post-retirement benefits – continued
The UK plan is closed to new joiners but remains open to ongoing accrual for current members. New joiners in the UK are eligible for membership of a
defined contribution plan.
In the US, a range of retirement arrangements is provided. This includes a funded final salary pension plan for certain heritage employees and a cash
balance arrangement for new joiners. Retired US employees typically take their pension benefit in the form of a lump sum payment. The plan’s assets
are overseen by a fiduciary investment committee composed of seven company employees appointed by the appointing officer, who is the president
of BP Corporation North America Inc. The investment committee is required by law to act in the best interests of the plan participants and is
responsible for setting certain policies, such as the investment policies, of the plan. US employees are also eligible to participate in a defined
contribution (401k) plan in which employee contributions are matched with company contributions.
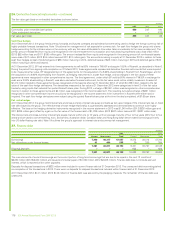
The level of contributions to funded defined benefit plans is the amount needed to provide adequate funds to meet pension obligations as they fall due.
During 2013, contributions of $597 million (2012 $884 million and 2011 $429 million) and $386 million (2012 $153 million and 2011 $777 million) were
made to the UK plans and US plans respectively. In addition, contributions of $289 million (2012 $238 million and 2011 $223 million) were made to
other funded defined benefit plans. The aggregate level of contributions in 2014 is expected to be approximately $1,250 million, and includes
contributions in all countries that we expect to be required to make by law or under contractual agreements as well as an allowance for discretionary
funding.
For the primary UK plan there is an agreement between the group and the trustee under which contributions are determined annually based on the
funding level of the plan. Under this agreement a proportion of any deficit and the service cost is funded in the following year. Contributions in the US
are determined by legislation and are supplemented by discretionary contributions.
Certain group companies, principally in the US, provide post-retirement healthcare and life insurance benefits to retired employees and their
dependants. The entitlement to these benefits is usually based on the employee remaining in service until retirement age and completion of a
minimum period of service.
The obligation and cost of providing pensions and other post-retirement benefits is assessed annually using the projected unit credit method. The date
of the most recent actuarial review was 31 December 2013. The group’s principal plans are subject to a formal actuarial valuation every three years in
the UK, with valuations being required more frequently in many other countries. The most recent formal actuarial valuation of the UK pension plans
was as at 31 December 2011.
The material financial assumptions used to estimate the benefit obligations of the various plans are set out below. The assumptions are reviewed by
management at the end of each year, and are used to evaluate accrued pension and other post-retirement benefits at 31 December and pension
expense for the following year.
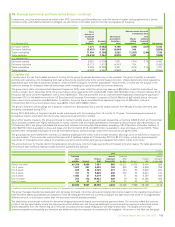
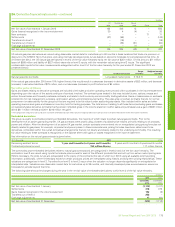
%
Financial assumptions used to determine benefit obligation
2013 2012
UK
2011 2013 2012
US
2011 2013 2012
Other
2011
Discount rate for pension plan liabilities 4.6 4.4 4.8 4.3 3.2 4.3 3.9 3.6 4.7
Discount rate for other post-retirement benefit plan
liabilities n/a n/a n/a 4.5 3.7 4.5 n/a n/a n/a
Rate of increase in salaries 5.1 4.9 5.1 3.9 4.2 3.7 3.7 3.7 3.7
Rate of increase for pensions in payment 3.3 3.1 3.2 –––1.7 1.7 1.7
Rate of increase in deferred pensions 3.3 3.1 3.2 –––1.3 1.2 1.2
Inflation for pension plan liabilities 3.3 3.1 3.2 2.1 2.4 1.9 2.2 2.2 2.2
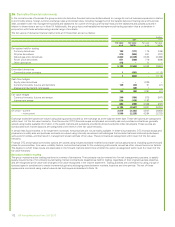
Financial assumptions used to determine benefit expense
2013 2012
UK
2011 2013 2012
US
2011 2013 2012
Other
2011
Discount rate for pension plan service cost 4.4 4.8 5.5 3.2 4.3 4.7 3.6 4.7 5.3
Discount rate for pension plan other finance expense 4.4 4.8 5.5 3.2 4.3 4.7 3.6 4.7 5.3
Discount rate for other post-retirement benefit plan
service cost n/a n/a n/a 3.7 4.5 5.3 n/a n/a n/a
Inflation for pension plan service cost 3.1 3.2 3.5 2.4 1.9 2.3 2.2 2.2 2.3
Our discount rate assumptions are based on third-party AA corporate bond indices and for our largest plans in the UK, US and Germany we use yields
that reflect the maturity profile of the expected benefit payments. The inflation rate assumptions for our UK and US plans are based on the difference
between the yields on index-linked and fixed-interest long-term government bonds. In other countries we use either this approach, or the central bank
inflation target, or advice from the local actuary depending on the information that is available to us. The inflation assumptions are used to determine
the rate of increase for pensions in payment and the rate of increase in deferred pensions where there is such an increase.
Our assumptions for the rate of increase in salaries are based on our inflation assumption plus an allowance for expected long-term real salary growth.
These include allowance for promotion-related salary growth, of between 0.3% and 1.0% depending on country.
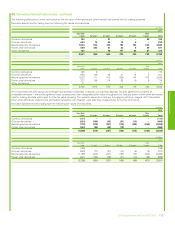
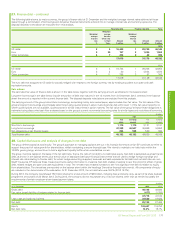
In addition to the financial assumptions, we regularly review the demographic and mortality assumptions. The mortality assumptions reflect best
practice in the countries in which we provide pensions, and have been chosen with regard to the latest available published tables adjusted where
appropriate to reflect the experience of the group and an extrapolation of past longevity improvements into the future. BP’s most substantial pension
liabilities are in the UK, the US and Germany where our mortality assumptions are as follows:
Years
Mortality assumptions
2013 2012
UK
2011 2013 2012
US
2011 2013 2012
Germanya
2011
Life expectancy at age 60 for a male currently aged 60 27.8 27.7 27.6 24.9 24.9 24.8 23.3 23.1 23.0
Life expectancy at age 60 for a male currently aged 40 30.7 30.6 30.5 26.4 26.3 26.3 26.1 26.0 25.8
Life expectancy at age 60 for a female currently aged 60 29.5 29.4 29.3 26.5 26.4 26.4 27.8 27.7 27.5
Life expectancy at age 60 for a female currently aged 40 32.2 32.1 32.0 27.3 27.3 27.3 30.5 30.3 30.2
aMinor amendments have been made to comparative amounts.
Financial statements
BP Annual Report and Form 20-F 2013 179