BP 2013 Annual Report Download - page 97
Download and view the complete annual report
Please find page 97 of the 2013 BP annual report below. You can navigate through the pages in the report by either clicking on the pages listed below, or by using the keyword search tool below to find specific information within the annual report.-
 1
1 -
2
-
3
-
4
-
5
-
6
-
7
-
8
-
9
-
10
-
11
-
12
-
13
-
14
-
15
-
16
-
17
-
18
-
19
-
20
-
21
-
22
-
23
-
24
-
25
-
26
-
27
-
28
-
29
-
30
-
31
-
32
-
33
-
34
-
35
-
36
-
37
-
38
-
39
-
40
-
41
-
42
-
43
-
44
-
45
-
46
-
47
-
48
-
49
-
50
-
51
-
52
-
53
-
54
-
55
-
56
-
57
-
58
-
59
-
60
-
61
-
62
-
63
-
64
-
65
-
66
-
67
-
68
-
69
-
70
-
71
-
72
-
73
-
74
-
75
-
76
-
77
-
78
-
79
-
80
-
81
-
82
-
83
-
84
-
85
-
86
-
 87
87 -
 88
88 -
 89
89 -
 90
90 -
 91
91 -
 92
92 -
 93
93 -
 94
94 -
 95
95 -
 96
96 -
 97
97 -
 98
98 -
 99
99 -
 100
100 -
 101
101 -
 102
102 -
 103
103 -
 104
104 -
 105
105 -
 106
106 -
 107
107 -
108
-
109
-
110
-
111
-
112
-
113
-
114
-
115
-
116
-
117
-
118
-
119
-
120
-
121
-
122
-
123
-
124
-
125
-
126
-
127
-
128
-
129
-
130
-
131
-
132
-
133
-
134
-
135
-
136
-
137
-
138
-
139
-
140
-
141
-
142
-
143
-
144
-
145
-
146
-
147
-
148
-
149
-
150
-
151
-
152
-
153
-
154
-
155
-
156
-
157
-
158
-
159
-
160
-
161
-
162
-
163
-
164
-
165
-
166
-
167
-
168
-
169
-
170
-
171
-
172
-
173
-
174
-
175
-
176
-
177
-
178
-
179
-
180
-
181
-
182
-
183
-
184
-
185
-
186
-
187
-
188
-
189
-
190
-
191
-
192
-
193
-
194
-
195
-
196
-
197
-
198
-
199
-
200
-
201
-
202
-
203
-
204
-
205
-
206
-
207
-
208
-
209
-
210
-
211
-
212
-
213
-
214
-
215
-
216
-
217
-
218
-
219
-
220
-
221
-
222
-
223
-
224
-
225
-
226
-
227
-
228
-
229
-
230
-
231
-
232
-
233
-
234
-
235
-
236
-
237
-
238
-
239
-
240
-
241
-
242
-
243
-
244
-
245
-
246
-
247
-
248
-
249
-
250
-
251
-
252
-
253
-
254
-
255
-
256
-
257
-
258
-
259
-
260
-
261
-
262
-
263
-
264
-
265
-
266
-
267
-
268
-
269
-
270
-
271
-
272
-
273
-
274
-
275
-
276
-
277
-
278
-
279
-
280
-
281
-
282
-
283
-
284
-
285
-
286
-
287
-
288
 |
 |

Corporate governance
BP Annual Report and Form 20-F 2013 93
Further details
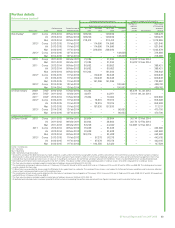
Deferred shares (audited)a
Deferred share element interests Interests vested in 2013 and 2014
Bonus year Type
Performance
period
Date of award of
deferred shares
Potential maximum deferred shares
Number of
ordinary
shares
vested Vesting date
Face value
of the award
at date of
grant £
At 1 Jan
2013
Awarded
2013
At 31 Dec
2013
Awarded
2014
Bob Dudleyb2011cComp 2012-2014 08 Mar 2012 109,206 –109,206 – – – 539,478
Vol 2012-2014 08 Mar 2012 109,206 –109,206 – – – 539,478
Mat 2012-2014 08 Mar 2012 218,412 –218,412 – – – 1,078,955
2012dComp 2013-2015 11 Feb 2013 –114 ,6 9 0 114 ,6 9 0 – – – 521,840
Vol 2013-2015 11 Feb 2013 –114 ,6 9 0 114 ,6 9 0 – – – 521,840
Mat 2013-2015 11 Feb 2013 –229,380 229,380 – – – 1,043,679
2013dComp 2014-2016 12 Feb 2014 – – – 149,628 – – 728,688
Mat 2014-2016 12 Feb 2014 – – – 149,628 – – 728,688
Iain Conn 2010 Comp 2011-2013 09 Mar 2011 21,384 –21,384 –24,670f12 Feb 2014 –
Mat 2011-2013 09 Mar 2011 21,38 4 –21,384 –24,670f12 Feb 2014 –
2011cComp 2012-2014 08 Mar 2012 80,652 –80,652 – – – 398,421
Vol 2012-2014 08 Mar 2012 80,652 –80,652 – – – 398,421
Mat 2012-2014 08 Mar 2012 161,304 –161,304 – – – 796,842
2012dComp 2013-2015 11 Feb 2013 –80,648 80,648 – – – 366,948
Vol 2013-2015 11 Feb 2013 –80,648 80,648 – – – 366,948
Mat 2013-2015 11 Feb 2013 –161,296 161,296 – – – 733,897
2013dComp 2014-2016 12 Feb 2014 – – – 100,563 – – 489,742
Mat 2014-2016 12 Feb 2014 – – – 100,563 – – 489,742
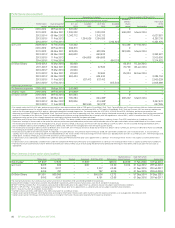
Dr Brian Gilvary 2009 DABe2010-2012 15 Mar 2010 8 7,3 9 4 – – – 95,279f15 Jan 2013 –
2010 DABe2011-2013 14 Mar 2011 44,971 –44,971 – 51,118f09 Jan 2014 –
2011hDABe2012-2014 15 Mar 2012 73,624 –73,624 – – – 362,966
2012dComp 2013-2015 11 Feb 2013 –78,815 78,815 – – – 358,608
Vol 2013-2015 11 Feb 2013 –78,815 78,815 – – – 358,608
Mat 2013-2015 11 Feb 2013 –157,6 30 15 7,6 3 0 – – – 717,217
2013dComp 2014-2016 12 Feb 2014 – – – 96,653 – – 470,700
Mat 2014-2016 12 Feb 2014 – – – 96,653 – – 470,700
Former executive director
Dr Byron Groteb2010 Comp 2011-2013 09 Mar 2011 26,604 –26,604 –30,174f12 Feb 2014 –
Vol 2011-2013 09 Mar 2011 26,604 –26,604 –3 0,174f12 Feb 2014 –
Mat 2011-2013 09 Mar 2011 53,208 –44,340i–50,292f12 Feb 2014 –
2011cComp 2012-2014 08 Mar 2012 91,638 –91,638 – – – 452,692
Vol 2012-2014 08 Mar 2012 91,638 –91,638 – – – 452,692
Mat 2012-2014 08 Mar 2012 183,276 –91,638i– – – 452,692
2012dComp 2013-2015 11 Feb 2013 –97,278 97,278 – – – 442,615
Vol 2013-2015 11 Feb 2013 –97,278 97,278 – – – 442,615
Mat 2013-2015 11 Feb 2013 –194,556 32,424i– – – 147,529
Comp = Compulsory.
Vol = Voluntary.
Mat = Matching.
DAB = Deferred annual bonus plan.
a Since 2010, vesting of the deferred shares has been subject to a safety and environmental sustainability hurdle, and this will continue. If the committee assesses that there has been a material
deterioration in safety and environmental performance, or there have been major incidents, either of which reveal underlying weaknesses in safety and environmental management, then it may
conclude that shares should vest only in part, or not at all. In reaching its conclusion, the committee will obtain advice from the SEEAC. There is no identified minimum vesting threshold level.
b Bob Dudley and Dr Byron Grote received awards in the form of ADSs. The above numbers reflect calculated equivalents in ordinary shares. One ADS is equivalent to six ordinary shares.
c The face value has been calculated using the market price of ordinary shares on 8 March 2012 of £4.94.
d The market price at closing of ordinary shares on 11 February 2013 was £4.55 and for ADSs was $43.01 and on 12 February 2014 was £4.87 and for ADSs was $48.38. The sterling value has been
used to calculate the face value.
e Dr Brian Gilvary was granted the shares under the DAB prior to his appointment as a director. The vesting of these shares is not subject to further performance conditions and he receives deferred
shares at each scrip payment date as part of his election choice.
f The market price of each share used to determine the total value at vesting on the vesting dates of 15 January 2013, 9 January 2014 and 12 February 2014 were £4.58, £4.97 and £4.90 respectively
and for ADSs on 12 February 2014 was $48.41.
h The face value has been calculated using the market price of ordinary shares on 15 March 2012 of £4.93.
i All deferred and matched shares have been prorated to reflect actual service during the performance period and these figures have been used to calculate the face value.