BP 2013 Annual Report Download - page 164
Download and view the complete annual report
Please find page 164 of the 2013 BP annual report below. You can navigate through the pages in the report by either clicking on the pages listed below, or by using the keyword search tool below to find specific information within the annual report.-
 1
1 -
2
-
3
-
4
-
5
-
6
-
7
-
8
-
9
-
10
-
11
-
12
-
13
-
14
-
15
-
16
-
17
-
18
-
19
-
20
-
21
-
22
-
23
-
24
-
25
-
26
-
27
-
28
-
29
-
30
-
31
-
32
-
33
-
34
-
35
-
36
-
37
-
38
-
39
-
40
-
41
-
42
-
43
-
44
-
45
-
46
-
47
-
48
-
49
-
50
-
51
-
52
-
53
-
54
-
55
-
56
-
57
-
58
-
59
-
60
-
61
-
62
-
63
-
64
-
65
-
66
-
67
-
68
-
69
-
70
-
71
-
72
-
73
-
74
-
75
-
76
-
77
-
78
-
79
-
80
-
81
-
82
-
83
-
84
-
85
-
86
-
87
-
88
-
89
-
90
-
91
-
92
-
93
-
94
-
95
-
96
-
97
-
98
-
99
-
100
-
101
-
102
-
103
-
104
-
105
-
106
-
107
-
108
-
109
-
110
-
111
-
112
-
113
-
114
-
115
-
116
-
117
-
118
-
119
-
120
-
121
-
122
-
123
-
124
-
125
-
126
-
127
-
128
-
129
-
130
-
131
-
132
-
133
-
134
-
135
-
136
-
137
-
138
-
139
-
140
-
141
-
142
-
143
-
144
-
145
-
146
-
147
-
148
-
149
-
150
-
151
-
152
-
153
-
 154
154 -
 155
155 -
 156
156 -
 157
157 -
 158
158 -
 159
159 -
 160
160 -
 161
161 -
 162
162 -
 163
163 -
 164
164 -
 165
165 -
 166
166 -
 167
167 -
 168
168 -
 169
169 -
 170
170 -
 171
171 -
 172
172 -
 173
173 -
 174
174 -
175
-
176
-
177
-
178
-
179
-
180
-
181
-
182
-
183
-
184
-
185
-
186
-
187
-
188
-
189
-
190
-
191
-
192
-
193
-
194
-
195
-
196
-
197
-
198
-
199
-
200
-
201
-
202
-
203
-
204
-
205
-
206
-
207
-
208
-
209
-
210
-
211
-
212
-
213
-
214
-
215
-
216
-
217
-
218
-
219
-
220
-
221
-
222
-
223
-
224
-
225
-
226
-
227
-
228
-
229
-
230
-
231
-
232
-
233
-
234
-
235
-
236
-
237
-
238
-
239
-
240
-
241
-
242
-
243
-
244
-
245
-
246
-
247
-
248
-
249
-
250
-
251
-
252
-
253
-
254
-
255
-
256
-
257
-
258
-
259
-
260
-
261
-
262
-
263
-
264
-
265
-
266
-
267
-
268
-
269
-
270
-
271
-
272
-
273
-
274
-
275
-
276
-
277
-
278
-
279
-
280
-
281
-
282
-
283
-
284
-
285
-
286
-
287
-
288
 |
 |

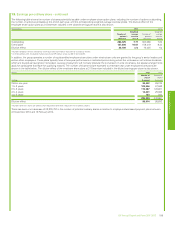
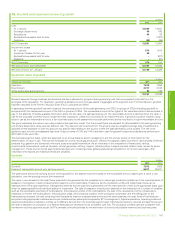
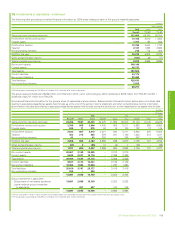
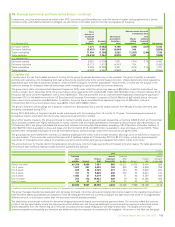
14. Property, plant and equipment
$ million
Land
and land
improvements Buildings
Oil and
gas
properties
Plant,
machinery
and
equipment
Fixtures,
fittings
and office
equipment Transportation
Oil depots,
storage
tanks and
service
stations Total
Cost
At 1 January 2013 3,279 2,812 171,772 45,200 3,346 13,436 9,059 248,904
Exchange adjustments (4) (26) – (235) 5 (55) (36) (351)
Additions 120 286 14,272 4,386 299 51 625 20,039
Acquisitions –– – 8 – – – 8
Transfers – – 4,365 – – – – 4,365
Deletions (20) (45) (2,718) (447) (474) (118) (257) (4,079)
At 31 December 2013 3,375 3,027 187,691 48,912 3,176 13,314 9,391 268,886
Depreciation
At 1 January 2013 514 1,023 87,965 18,628 2,119 8,409 4,915 123,573
Exchange adjustments (6) (1) – (61) 7 (28) (7) (96)
Charge for the year 37 129 10,334 1,616 278 347 502 13,243
Impairment losses 10 20 611 525 – 160 35 1,361
Impairment reversals – – (209) – – (17) – (226)
Transfers – – 365 – – – – 365
Deletions (5) (30) (2,003) (330) (434) (38) (184) (3,024)
At 31 December 2013 550 1,141 97,063 20,378 1,970 8,833 5,261 135,196
Net book amount at 31 December 2013 2,825 1,886 90,628 28,534 1,206 4,481 4,130 133,690
Cost
At 1 January 2012 3,169 2,942 176,988 41,319 3,140 12,753 8,611 248,922
Exchange adjustments 86 14 – 320 28 8 272 728
Additions 120 387 16,303 4,481 314 902 533 23,040
Acquisitions – – 44 2 – 15 – 61
Transfers – – 1,306 – – – – 1,306
Reclassified as assets held for sale – – (19,410) (143) – (172) (2) (19,727)
Deletions (96) (531) (3,459) (779) (136) (70) (355) (5,426)
At 31 December 2012 3,279 2,812 171,772 45,200 3,346 13,436 9,059 248,904
Depreciation
At 1 January 2012 511 1,411 91,994 16,915 1,940 8,149 4,571 125,491
Exchange adjustments 8 13 – 228 25 6 151 431
Charge for the year 33 123 9,659 1,442 289 320 504 12,370
Impairment losses 8 – 2,765 493 – 70 7 3,343
Impairment reversals – – (221) – – – (1) (222)
Reclassified as assets held for sale – – (13,774) (36) – (126) (2) (13,938)
Deletions (46) (524) (2,458) (414) (135) (10) (315) (3,902)
At 31 December 2012 514 1,023 87,965 18,628 2,119 8,409 4,915 123,573
Net book amount at 31 December 2012 2,765 1,789 83,807 26,572 1,227 5,027 4,144 125,331
Net book amount at 1 January 2012 2,658 1,531 84,994 24,404 1,200 4,604 4,040 123,431
Assets held under finance leases at net book amount
included above
At 31 December 2013 – 7 187 265 – 4 – 463
At 31 December 2012 – 9 157 254 – 9 – 429
Assets under construction included above
At 31 December 2013 27,900
At 31 December 2012 29,203
160 BP Annual Report and Form 20-F 2013