BP 2013 Annual Report Download - page 176
Download and view the complete annual report
Please find page 176 of the 2013 BP annual report below. You can navigate through the pages in the report by either clicking on the pages listed below, or by using the keyword search tool below to find specific information within the annual report.-
 1
1 -
2
-
3
-
4
-
5
-
6
-
7
-
8
-
9
-
10
-
11
-
12
-
13
-
14
-
15
-
16
-
17
-
18
-
19
-
20
-
21
-
22
-
23
-
24
-
25
-
26
-
27
-
28
-
29
-
30
-
31
-
32
-
33
-
34
-
35
-
36
-
37
-
38
-
39
-
40
-
41
-
42
-
43
-
44
-
45
-
46
-
47
-
48
-
49
-
50
-
51
-
52
-
53
-
54
-
55
-
56
-
57
-
58
-
59
-
60
-
61
-
62
-
63
-
64
-
65
-
66
-
67
-
68
-
69
-
70
-
71
-
72
-
73
-
74
-
75
-
76
-
77
-
78
-
79
-
80
-
81
-
82
-
83
-
84
-
85
-
86
-
87
-
88
-
89
-
90
-
91
-
92
-
93
-
94
-
95
-
96
-
97
-
98
-
99
-
100
-
101
-
102
-
103
-
104
-
105
-
106
-
107
-
108
-
109
-
110
-
111
-
112
-
113
-
114
-
115
-
116
-
117
-
118
-
119
-
120
-
121
-
122
-
123
-
124
-
125
-
126
-
127
-
128
-
129
-
130
-
131
-
132
-
133
-
134
-
135
-
136
-
137
-
138
-
139
-
140
-
141
-
142
-
143
-
144
-
145
-
146
-
147
-
148
-
149
-
150
-
151
-
152
-
153
-
154
-
155
-
156
-
157
-
158
-
159
-
160
-
161
-
162
-
163
-
164
-
165
-
 166
166 -
 167
167 -
 168
168 -
 169
169 -
 170
170 -
 171
171 -
 172
172 -
 173
173 -
 174
174 -
 175
175 -
 176
176 -
 177
177 -
 178
178 -
 179
179 -
 180
180 -
 181
181 -
 182
182 -
 183
183 -
 184
184 -
 185
185 -
 186
186 -
187
-
188
-
189
-
190
-
191
-
192
-
193
-
194
-
195
-
196
-
197
-
198
-
199
-
200
-
201
-
202
-
203
-
204
-
205
-
206
-
207
-
208
-
209
-
210
-
211
-
212
-
213
-
214
-
215
-
216
-
217
-
218
-
219
-
220
-
221
-
222
-
223
-
224
-
225
-
226
-
227
-
228
-
229
-
230
-
231
-
232
-
233
-
234
-
235
-
236
-
237
-
238
-
239
-
240
-
241
-
242
-
243
-
244
-
245
-
246
-
247
-
248
-
249
-
250
-
251
-
252
-
253
-
254
-
255
-
256
-
257
-
258
-
259
-
260
-
261
-
262
-
263
-
264
-
265
-
266
-
267
-
268
-
269
-
270
-
271
-
272
-
273
-
274
-
275
-
276
-
277
-
278
-
279
-
280
-
281
-
282
-
283
-
284
-
285
-
286
-
287
-
288
 |
 |

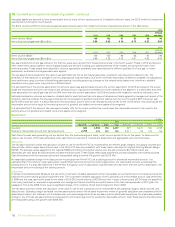
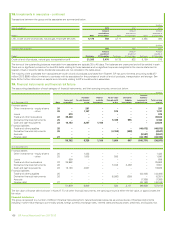
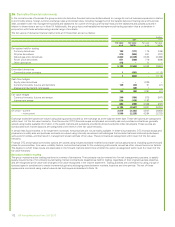
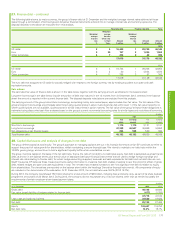
26. Derivative financial instruments
In the normal course of business the group enters into derivative financial instruments (derivatives) to manage its normal business exposures in relation
to commodity prices, foreign currency exchange rates and interest rates, including management of the balance between floating rate and fixed rate
debt, consistent with risk management policies and objectives. An outline of the group’s financial risks and the objectives and policies pursued in
relation to those risks is set out in Note 19. Additionally, the group has a well-established entrepreneurial trading operation that is undertaken in
conjunction with these activities using a similar range of contracts.
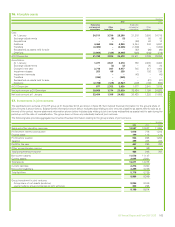
The fair values of derivative financial instruments at 31 December are set out below.
$ million
2013 2012
Fair value
asset
Fair value
liability
Fair value
asset
Fair value
liability
Derivatives held for trading
Currency derivatives 192 (111) 175 (189)
Oil price derivatives 810 (806) 841 (707)
Natural gas price derivatives 2,840 (2,029) 3,536 (2,496)
Power price derivatives 871 (560) 719 (589)
Other derivatives 475 – 71 –
5,188 (3,506) 5,342 (3,981)
Embedded derivatives
Commodity price contracts 1 (653) – (1,112)
1 (653) – (1,112)
Cash flow hedges
Equity price derivatives ––1,339 –
Currency forwards, futures and cylinders 129 (30) 51 (41)
Cross-currency interest rate swaps – (69) 1–
129 (99) 1,391 (41)
Fair value hedges
Currency forwards, futures and swaps 340 (154) 875 (247)
Interest rate swaps 526 (135) 1,193 –
866 (289) 2,068 (247)
6,184 (4,547) 8,801 (5,381)
Of which – current 2,675 (2,322) 4,507 (2,658)
– non-current 3,509 (2,225) 4,294 (2,723)
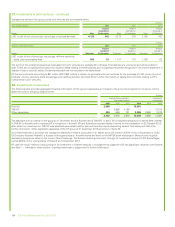
Exchange traded derivatives are valued using closing prices provided by the exchange as at the balance sheet date. These derivatives are categorized
within level 1 of the fair value hierarchy. Over-the-counter (OTC) financial swaps and physical commodity sale and purchase contracts are generally
valued using readily available information in the public markets and quotations provided by brokers and price index developers. These quotes are
corroborated with market data and are categorized within level 2 of the fair value hierarchy.
In certain less liquid markets, or for longer-term contracts, forward prices are not as readily available. In these circumstances, OTC financial swaps and
physical commodity sale and purchase contracts are valued using internally developed methodologies that consider historical relationships between
various commodities, and that result in management’s best estimate of fair value. These contracts are categorized within level 3 of the fair value
hierarchy.
Financial OTC and physical commodity options are valued using industry standard models that consider various assumptions, including quoted forward
prices for commodities, time value, volatility factors, and contractual prices for the underlying instruments, as well as other relevant economic factors.
The degree to which these inputs are observable in the forward markets determines whether the option is categorized within level 2 or level 3 of the
fair value hierarchy.
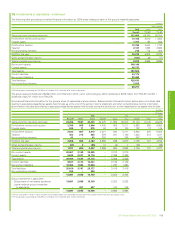
Derivatives held for trading
The group maintains active trading positions in a variety of derivatives. The contracts may be entered into for risk management purposes, to satisfy
supply requirements or for entrepreneurial trading. Certain contracts are classified as held for trading, regardless of their original business objective,
and are recognized at fair value with changes in fair value recognized in the income statement. Trading activities are undertaken by using a range of
contract types in combination to create incremental gains by arbitraging prices between markets, locations and time periods. The net of these
exposures is monitored using market value-at-risk techniques as described in Note 19.
172 BP Annual Report and Form 20-F 2013