BP 2013 Annual Report Download - page 179
Download and view the complete annual report
Please find page 179 of the 2013 BP annual report below. You can navigate through the pages in the report by either clicking on the pages listed below, or by using the keyword search tool below to find specific information within the annual report.-
 1
1 -
2
-
3
-
4
-
5
-
6
-
7
-
8
-
9
-
10
-
11
-
12
-
13
-
14
-
15
-
16
-
17
-
18
-
19
-
20
-
21
-
22
-
23
-
24
-
25
-
26
-
27
-
28
-
29
-
30
-
31
-
32
-
33
-
34
-
35
-
36
-
37
-
38
-
39
-
40
-
41
-
42
-
43
-
44
-
45
-
46
-
47
-
48
-
49
-
50
-
51
-
52
-
53
-
54
-
55
-
56
-
57
-
58
-
59
-
60
-
61
-
62
-
63
-
64
-
65
-
66
-
67
-
68
-
69
-
70
-
71
-
72
-
73
-
74
-
75
-
76
-
77
-
78
-
79
-
80
-
81
-
82
-
83
-
84
-
85
-
86
-
87
-
88
-
89
-
90
-
91
-
92
-
93
-
94
-
95
-
96
-
97
-
98
-
99
-
100
-
101
-
102
-
103
-
104
-
105
-
106
-
107
-
108
-
109
-
110
-
111
-
112
-
113
-
114
-
115
-
116
-
117
-
118
-
119
-
120
-
121
-
122
-
123
-
124
-
125
-
126
-
127
-
128
-
129
-
130
-
131
-
132
-
133
-
134
-
135
-
136
-
137
-
138
-
139
-
140
-
141
-
142
-
143
-
144
-
145
-
146
-
147
-
148
-
149
-
150
-
151
-
152
-
153
-
154
-
155
-
156
-
157
-
158
-
159
-
160
-
161
-
162
-
163
-
164
-
165
-
166
-
167
-
168
-
 169
169 -
 170
170 -
 171
171 -
 172
172 -
 173
173 -
 174
174 -
 175
175 -
 176
176 -
 177
177 -
 178
178 -
 179
179 -
 180
180 -
 181
181 -
 182
182 -
 183
183 -
 184
184 -
 185
185 -
 186
186 -
 187
187 -
 188
188 -
 189
189 -
190
-
191
-
192
-
193
-
194
-
195
-
196
-
197
-
198
-
199
-
200
-
201
-
202
-
203
-
204
-
205
-
206
-
207
-
208
-
209
-
210
-
211
-
212
-
213
-
214
-
215
-
216
-
217
-
218
-
219
-
220
-
221
-
222
-
223
-
224
-
225
-
226
-
227
-
228
-
229
-
230
-
231
-
232
-
233
-
234
-
235
-
236
-
237
-
238
-
239
-
240
-
241
-
242
-
243
-
244
-
245
-
246
-
247
-
248
-
249
-
250
-
251
-
252
-
253
-
254
-
255
-
256
-
257
-
258
-
259
-
260
-
261
-
262
-
263
-
264
-
265
-
266
-
267
-
268
-
269
-
270
-
271
-
272
-
273
-
274
-
275
-
276
-
277
-
278
-
279
-
280
-
281
-
282
-
283
-
284
-
285
-
286
-
287
-
288
 |
 |

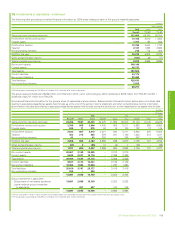
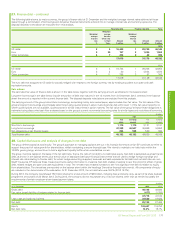
26. Derivative financial instruments – continued
$ million
Oil
price
Natural gas
price
Power
price Other Total
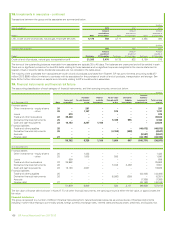
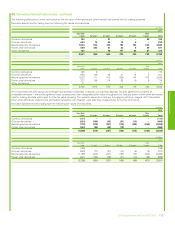
Net fair value of contracts at 1 January 2012 162 408 13 – 583
Gains (losses) recognized in the income statement 30 4 (4) – 30
New contracts – – – 71 71
Settlements (87) (56) – – (143)
Transfers into level 3 – (19) – – (19)
Transfers out of level 3 – (33) (51) – (84)
Exchange adjustments – – (1) – (1)
Net fair value of contracts at 31 December 2012 105 304 (43) 71 437
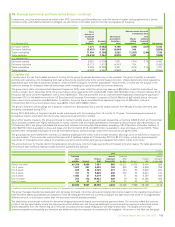
US natural gas price derivatives are valued using observable market data for maturities up to 60 months in basis locations that trade at a premium or
discount to the NYMEX Henry Hub price, and using internally developed price curves based on economic forecasts for periods beyond that time. At
31 December 2013, the US natural gas derivatives in level 3 of the fair value hierarchy had a net fair value of $351 million. Of this amount, $71 million
(asset of $598 million and liability of $527 million) depends on level 3 inputs, with the remainder valued using level 2 inputs. The significant
unobservable inputs for fair value measurements categorized within level 3 of the fair value hierarchy for the year ended 31 December 2013 are
presented below.
Unobservable inputs
Range
$/mmBtu
Weighted average
$/mmBtu
Natural gas price contracts Long-dated market price 3.15-6.71 4.63
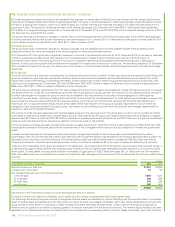
If the natural gas prices after 2018 were 10% higher (lower), this would result in a decrease (increase) in derivative assets of $82 million, and decrease
(increase) in derivative liabilities of $78 million, and a net decrease (increase) in profit before tax of $4 million.
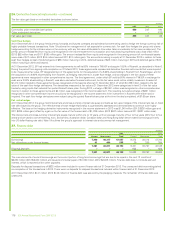
Derivative gains and losses
Gains and losses relating to derivative contracts are included within sales and other operating revenues and within purchases in the income statement
depending upon the nature of the activity and type of contract involved. The contract types treated in this way include futures, options, swaps and
certain forward sales and forward purchases contracts, and relate to both currency and commodity trading activities. Gains or losses arise on contracts
entered into for risk management purposes, optimization activity and entrepreneurial trading. They also arise on certain contracts that are for normal
procurement or sales activity for the group but that are required to be fair valued under accounting standards. Also included within sales and other
operating revenues are gains and losses on inventory held for trading purposes. The total amount relating to all these items (excluding gains and losses
on realized physical derivative contracts that have been reflected gross in the income statement within sales and purchases) was a gain of $587 million
(2012 $411 million net loss and 2011 $216 million net gaina).
aThe comparative amounts for 2012 and 2011 have been amended and now reflect only the margin on derivative contracts that have been reflected net within the income statement.
Embedded derivatives
The group is a party to contracts containing embedded derivatives, the majority of which relate to certain natural gas contracts. Prior to the
development of an active gas trading market, UK gas contracts were priced using a basket of available price indices, primarily relating to oil products,
power and inflation. After the development of an active UK gas market, certain contracts were entered into or renegotiated using pricing formulae not
directly related to gas prices, for example, oil product and power prices. In these circumstances, pricing formulae have been determined to be
derivatives, embedded within the overall contractual arrangements that are not clearly and closely related to the underlying commodity. The resulting
fair value relating to these contracts is recognized on the balance sheet with gains or losses recognized in the income statement.
Key information on the natural gas contracts is given below.
At 31 December 2013 2012
Remaining contract terms 1 year and 5 months to 4 years and 9 months 2 years and 5 months to 5 years and 9 months
Contractual/notional amount 153 million therms 117 million therms
The commodity price embedded derivatives relate to natural gas contracts and are categorized in levels 2 and 3 of the fair value hierarchy. The
contracts in level 2 are valued using inputs that include price curves for each of the different products that are built up from active market pricing data.
Where necessary, the price curves are extrapolated to the expiry of the contracts (the last of which is in 2018) using all available external pricing
information; additionally, where limited data exists for certain products, prices are interpolated using historic and long-term pricing relationships. These
valuations are categorized in level 3. Transfers from level 3 to level 2 occur when the valuation no longer depends significantly on extrapolated or
interpolated data. Valuations use observable market data for maturities up to 36 months, and internally developed price curves based on economic
forecasts for periods beyond that time.
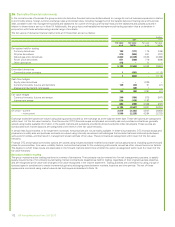
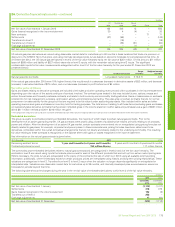
The following table shows the changes during the year in the net fair value of embedded derivatives, within level 3 of the fair value hierarchy.
$ million
2013 2012
Commodity
price
Commodity
price
Net fair value of contracts at 1 January (1,112) (1,417)
Settlements 316 375
Gains (losses) recognized in the income statement 142 (6)
Transfers out of level 3 258 –
Exchange adjustments 17 (64)
Net fair value of contracts at 31 December (379) (1,112)
Financial statements
BP Annual Report and Form 20-F 2013 175