BP 2013 Annual Report Download - page 91
Download and view the complete annual report
Please find page 91 of the 2013 BP annual report below. You can navigate through the pages in the report by either clicking on the pages listed below, or by using the keyword search tool below to find specific information within the annual report.-
 1
1 -
2
-
3
-
4
-
5
-
6
-
7
-
8
-
9
-
10
-
11
-
12
-
13
-
14
-
15
-
16
-
17
-
18
-
19
-
20
-
21
-
22
-
23
-
24
-
25
-
26
-
27
-
28
-
29
-
30
-
31
-
32
-
33
-
34
-
35
-
36
-
37
-
38
-
39
-
40
-
41
-
42
-
43
-
44
-
45
-
46
-
47
-
48
-
49
-
50
-
51
-
52
-
53
-
54
-
55
-
56
-
57
-
58
-
59
-
60
-
61
-
62
-
63
-
64
-
65
-
66
-
67
-
68
-
69
-
70
-
71
-
72
-
73
-
74
-
75
-
76
-
77
-
78
-
79
-
80
-
 81
81 -
 82
82 -
 83
83 -
 84
84 -
 85
85 -
 86
86 -
 87
87 -
 88
88 -
 89
89 -
 90
90 -
 91
91 -
 92
92 -
 93
93 -
 94
94 -
 95
95 -
 96
96 -
 97
97 -
 98
98 -
 99
99 -
 100
100 -
 101
101 -
102
-
103
-
104
-
105
-
106
-
107
-
108
-
109
-
110
-
111
-
112
-
113
-
114
-
115
-
116
-
117
-
118
-
119
-
120
-
121
-
122
-
123
-
124
-
125
-
126
-
127
-
128
-
129
-
130
-
131
-
132
-
133
-
134
-
135
-
136
-
137
-
138
-
139
-
140
-
141
-
142
-
143
-
144
-
145
-
146
-
147
-
148
-
149
-
150
-
151
-
152
-
153
-
154
-
155
-
156
-
157
-
158
-
159
-
160
-
161
-
162
-
163
-
164
-
165
-
166
-
167
-
168
-
169
-
170
-
171
-
172
-
173
-
174
-
175
-
176
-
177
-
178
-
179
-
180
-
181
-
182
-
183
-
184
-
185
-
186
-
187
-
188
-
189
-
190
-
191
-
192
-
193
-
194
-
195
-
196
-
197
-
198
-
199
-
200
-
201
-
202
-
203
-
204
-
205
-
206
-
207
-
208
-
209
-
210
-
211
-
212
-
213
-
214
-
215
-
216
-
217
-
218
-
219
-
220
-
221
-
222
-
223
-
224
-
225
-
226
-
227
-
228
-
229
-
230
-
231
-
232
-
233
-
234
-
235
-
236
-
237
-
238
-
239
-
240
-
241
-
242
-
243
-
244
-
245
-
246
-
247
-
248
-
249
-
250
-
251
-
252
-
253
-
254
-
255
-
256
-
257
-
258
-
259
-
260
-
261
-
262
-
263
-
264
-
265
-
266
-
267
-
268
-
269
-
270
-
271
-
272
-
273
-
274
-
275
-
276
-
277
-
278
-
279
-
280
-
281
-
282
-
283
-
284
-
285
-
286
-
287
-
288
 |
 |

Corporate governance
BP Annual Report and Form 20-F 2013 87
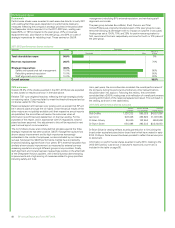
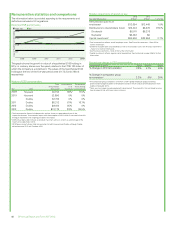
2013 overall bonus outcome
Paid
in cash
Total
deferred
Bob Dudley $2,343,660 $1,171,830
Iain Conn £961,380 £480,690
Dr Brian Gilvary £924,000 £462,000
Dr Byron Grote $1,470,150 $0
2014 implementation
For 2014, 100% of Bob Dudley’s and Dr Brian Gilvary’s bonus will be based
on group results. Iain Conn will again have 70% of his bonus determined on
group results and 30% on his Downstream segment results.
The committee determines specific measures and targets each year that
reflect the priorities in the group’s annual plan and KPIs, both of which are
derived from the company’s strategy. For 2014 there will be no change
from the measures and weightings used in 2013 other than a minor change
to the treatment of cost management. The table below shows the group
measures that will be used, the weight attached to each and the alignment
with KPIs and group strategy.
Targets have been agreed for each of the measures based on the annual
plan. In addition the committee uses its judgement to set the range of
bonus payouts from minimum acceptable at threshold to very stretching
but achievable at maximum.
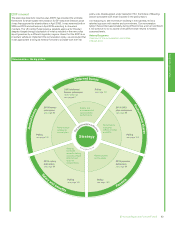
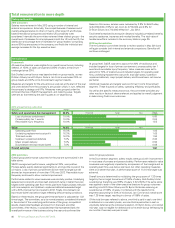
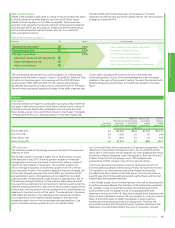
2014 annual bonus measures
Safety and operational risk management
Value
30.0%
70.0%
Measures KPI Weight Link to strategy
Loss of primary containment 10.0%
Process safety tier 1 events 10.0% Safe, reliable and compliant operations
Recordable injury frequency 10.0%
Operating cash flow 16.3%
Underlying replacement cost profit 16.3%
Cost management 16.3%
Upstream unplanned deferrals 7.0%
Major project delivery 7.0%
Downstream net income per barrel 7.0%
Disciplined financial choices
Competitive project execution
Focus on high-value Upstream assets
Grow our exploration position
Build high-quality Downstream businesses
Deferred bonus
Framework
One-third of the total bonus awarded to the executive directors is required
to be paid in shares under the terms of the deferred bonus element.
Deferred shares are matched on a one-for-one basis and, after three years,
vesting for both deferred and matched shares is contingent on an
assessment of safety and environmental sustainability over the three-year
deferral period.
Individuals may elect to defer up to an additional one-third of total bonus
into shares on the same basis and subject to the same contingency as the
mandatory deferral.
2013 outcomes
No bonuses were paid for group results in 2010, however both Iain Conn
and Dr Byron Grote received a limited bonus related to their segment
results that year. Deferrals from these were converted to shares, matched
one-for-one, and deferred for three years from the start of 2011. The
three-year performance period concluded at the end of 2013 and vesting
was subject to a review of safety and environmental sustainability
performance over the three-year deferral period. The committee reviewed
safety and environmental sustainability performance over this period and,
as part of this review, sought the input of the safety, ethics and
environment assurance committee (SEEAC). Over the three-year period
2011-2013 safety measures showed a steady improvement, there were no
major incidents, and the group-wide operating management system
showed good signs of driving improvement in environmental as well as
safety areas.
Based on their review, the committee approved full vesting of the deferred
and matched shares for the 2010 deferred bonus as shown in the following
table (as well as in the total remuneration summary chart on page 85).
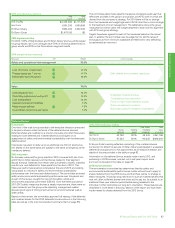
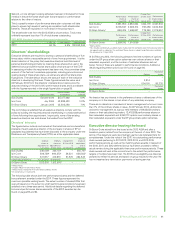
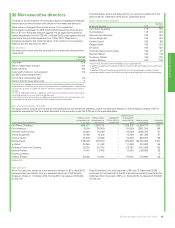
2010 deferred bonus vesting
Name
Shares
deferred
Vesting
agreed
Total shares
including
dividends
Total
value
at vesting
Iain Conn 42,768 100% 49,340 £241,766
Dr Byron Grote 97,548 100% 110,640 $892,680
Dr Byron Grote’s vesting reflected a prorating of the matched shares
component to reflect his service. Dr Brian Gilvary participated in a separate
deferred bonus plan prior to his appointment as an executive director and
details of this are provided in the table on page 93.
Information on the deferred bonus awards made in early 2013, and
pertaining to 2012 bonuses, was set out in last year’s report and a
summary is included in the table on page 85.
2014 implementation
The remuneration committee has determined that the safety and
environmental sustainability performance hurdle will continue to apply to
shares deferred from the 2013 bonus and that there will be no change to
these measures. It has also proposed that in future all matched shares that
vest will, after sufficient shares have been sold to pay tax, be subject to an
additional three-year retention period before being released to the
individual, further reinforcing our long-term orientation. These features are
described in more detail in the policy section of the report and have been
implemented for shares deferred from the 2013 bonus.