BP 2013 Annual Report Download - page 175
Download and view the complete annual report
Please find page 175 of the 2013 BP annual report below. You can navigate through the pages in the report by either clicking on the pages listed below, or by using the keyword search tool below to find specific information within the annual report.-
 1
1 -
2
-
3
-
4
-
5
-
6
-
7
-
8
-
9
-
10
-
11
-
12
-
13
-
14
-
15
-
16
-
17
-
18
-
19
-
20
-
21
-
22
-
23
-
24
-
25
-
26
-
27
-
28
-
29
-
30
-
31
-
32
-
33
-
34
-
35
-
36
-
37
-
38
-
39
-
40
-
41
-
42
-
43
-
44
-
45
-
46
-
47
-
48
-
49
-
50
-
51
-
52
-
53
-
54
-
55
-
56
-
57
-
58
-
59
-
60
-
61
-
62
-
63
-
64
-
65
-
66
-
67
-
68
-
69
-
70
-
71
-
72
-
73
-
74
-
75
-
76
-
77
-
78
-
79
-
80
-
81
-
82
-
83
-
84
-
85
-
86
-
87
-
88
-
89
-
90
-
91
-
92
-
93
-
94
-
95
-
96
-
97
-
98
-
99
-
100
-
101
-
102
-
103
-
104
-
105
-
106
-
107
-
108
-
109
-
110
-
111
-
112
-
113
-
114
-
115
-
116
-
117
-
118
-
119
-
120
-
121
-
122
-
123
-
124
-
125
-
126
-
127
-
128
-
129
-
130
-
131
-
132
-
133
-
134
-
135
-
136
-
137
-
138
-
139
-
140
-
141
-
142
-
143
-
144
-
145
-
146
-
147
-
148
-
149
-
150
-
151
-
152
-
153
-
154
-
155
-
156
-
157
-
158
-
159
-
160
-
161
-
162
-
163
-
164
-
 165
165 -
 166
166 -
 167
167 -
 168
168 -
 169
169 -
 170
170 -
 171
171 -
 172
172 -
 173
173 -
 174
174 -
 175
175 -
 176
176 -
 177
177 -
 178
178 -
 179
179 -
 180
180 -
 181
181 -
 182
182 -
 183
183 -
 184
184 -
 185
185 -
186
-
187
-
188
-
189
-
190
-
191
-
192
-
193
-
194
-
195
-
196
-
197
-
198
-
199
-
200
-
201
-
202
-
203
-
204
-
205
-
206
-
207
-
208
-
209
-
210
-
211
-
212
-
213
-
214
-
215
-
216
-
217
-
218
-
219
-
220
-
221
-
222
-
223
-
224
-
225
-
226
-
227
-
228
-
229
-
230
-
231
-
232
-
233
-
234
-
235
-
236
-
237
-
238
-
239
-
240
-
241
-
242
-
243
-
244
-
245
-
246
-
247
-
248
-
249
-
250
-
251
-
252
-
253
-
254
-
255
-
256
-
257
-
258
-
259
-
260
-
261
-
262
-
263
-
264
-
265
-
266
-
267
-
268
-
269
-
270
-
271
-
272
-
273
-
274
-
275
-
276
-
277
-
278
-
279
-
280
-
281
-
282
-
283
-
284
-
285
-
286
-
287
-
288
 |
 |

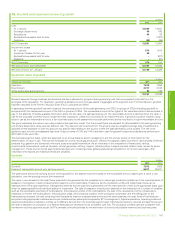
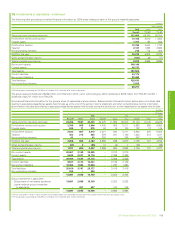
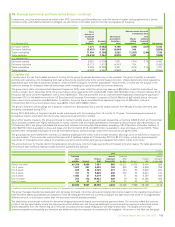
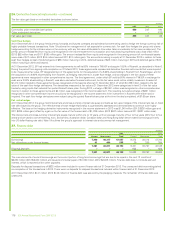
22. Trade and other receivables
$ million
2013 2012
Current Non-current Current Non-current
Financial assets
Trade receivables 28,868 183 26,485 151
Amounts receivable from joint ventures and associates 1,213 47 871 102
Other receivables 6,594 2,725 5,683 2,670
36,675 2,955 33,039 2,923
Non-financial assets
Gulf of Mexico oil spill trust fund reimbursement asseta2,457 2,442 4,178 2,264
Other receivables 699 588 394 774
3,156 3,030 4,572 3,038
39,831 5,985 37,611 5,961
aSee Note 2 for further information.
Trade and other receivables are predominantly non-interest bearing. See Note 19 for further information.
Receivables with a carrying amount of $236 million (2012 $12 million) have been pledged as security for certain of the group’s liabilities at
31 December 2013.
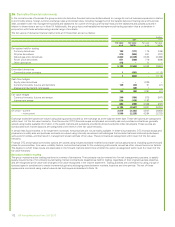
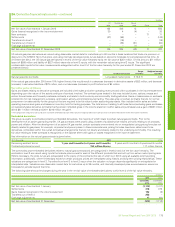
23. Cash and cash equivalents
$ million
2013 2012
Cash at bank and in hand 6,907 5,885
Term bank deposits 12,246 9,243
Cash equivalents 3,367 4,507
22,520 19,635
Cash and cash equivalents comprise cash in hand; current balances with banks and similar institutions; term deposits of three months or less with
banks and similar institutions; money market funds and commercial paper. The carrying amounts of cash at bank and in hand and term bank deposits
approximate their fair values. Substantially all of the other cash equivalents are categorized within level 1 of the fair value hierarchy.
Cash and cash equivalents at 31 December 2013 includes $1,626 million (2012 $1,544 million) that is restricted. Included in restricted cash at
31 December 2012 was $709 million relating to the dividend received from TNK-BP in December 2012 which remained restricted until completion of
the sale of BP’s interest in TNK-BP to Rosneft, which occurred in the first quarter of 2013. See Note 6 for further information. The remaining restricted
cash balances relate largely to amounts required to cover initial margin on trading exchanges.
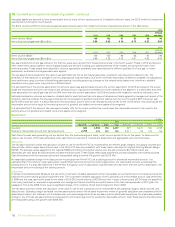
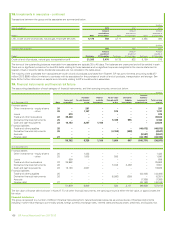
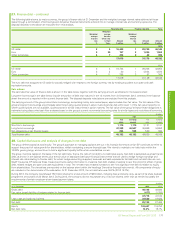
24. Valuation and qualifying accounts
$ million
2013 2012 2011
Accounts
receivable
Fixed asset
investments
Accounts
receivable
Fixed asset
investments
Accounts
receivable
Fixed asset
investments
At 1 January 489 349 332 643 428 540
Charged to costs and expenses 82 4 240 196 115 111
Charged to other accountsa(4) 4 7 18 (16) (3)
Deductions (224) (189) (90) (508) (195) (5)
At 31 December 343 168 489 349 332 643
aPrincipally currency transactions.
Valuation and qualifying accounts comprise impairment provisions for accounts receivable and fixed asset investments, and are deducted in the
balance sheet from the assets to which they apply.
25. Trade and other payables
$ million
2013 2012
Current Non-current Current Non-current
Financial liabilities
Trade payables 28,926 – 29,920 –
Amounts payable to joint ventures and associates 3,576 47 1,105 102
Other payables 11,288 4,235 11,487 1,791
43,790 4,282 42,512 1,893
Non-financial liabilities
Other payables 3,369 474 4,161 399
47,159 4,756 46,673 2,292
Trade and other payables are predominantly non-interest bearing. See Note 19 for further information.
Financial statements
BP Annual Report and Form 20-F 2013 171