BP 2013 Annual Report Download - page 189
Download and view the complete annual report
Please find page 189 of the 2013 BP annual report below. You can navigate through the pages in the report by either clicking on the pages listed below, or by using the keyword search tool below to find specific information within the annual report.-
 1
1 -
2
-
3
-
4
-
5
-
6
-
7
-
8
-
9
-
10
-
11
-
12
-
13
-
14
-
15
-
16
-
17
-
18
-
19
-
20
-
21
-
22
-
23
-
24
-
25
-
26
-
27
-
28
-
29
-
30
-
31
-
32
-
33
-
34
-
35
-
36
-
37
-
38
-
39
-
40
-
41
-
42
-
43
-
44
-
45
-
46
-
47
-
48
-
49
-
50
-
51
-
52
-
53
-
54
-
55
-
56
-
57
-
58
-
59
-
60
-
61
-
62
-
63
-
64
-
65
-
66
-
67
-
68
-
69
-
70
-
71
-
72
-
73
-
74
-
75
-
76
-
77
-
78
-
79
-
80
-
81
-
82
-
83
-
84
-
85
-
86
-
87
-
88
-
89
-
90
-
91
-
92
-
93
-
94
-
95
-
96
-
97
-
98
-
99
-
100
-
101
-
102
-
103
-
104
-
105
-
106
-
107
-
108
-
109
-
110
-
111
-
112
-
113
-
114
-
115
-
116
-
117
-
118
-
119
-
120
-
121
-
122
-
123
-
124
-
125
-
126
-
127
-
128
-
129
-
130
-
131
-
132
-
133
-
134
-
135
-
136
-
137
-
138
-
139
-
140
-
141
-
142
-
143
-
144
-
145
-
146
-
147
-
148
-
149
-
150
-
151
-
152
-
153
-
154
-
155
-
156
-
157
-
158
-
159
-
160
-
161
-
162
-
163
-
164
-
165
-
166
-
167
-
168
-
169
-
170
-
171
-
172
-
173
-
174
-
175
-
176
-
177
-
178
-
 179
179 -
 180
180 -
 181
181 -
 182
182 -
 183
183 -
 184
184 -
 185
185 -
 186
186 -
 187
187 -
 188
188 -
 189
189 -
 190
190 -
 191
191 -
 192
192 -
 193
193 -
 194
194 -
 195
195 -
 196
196 -
 197
197 -
 198
198 -
 199
199 -
200
-
201
-
202
-
203
-
204
-
205
-
206
-
207
-
208
-
209
-
210
-
211
-
212
-
213
-
214
-
215
-
216
-
217
-
218
-
219
-
220
-
221
-
222
-
223
-
224
-
225
-
226
-
227
-
228
-
229
-
230
-
231
-
232
-
233
-
234
-
235
-
236
-
237
-
238
-
239
-
240
-
241
-
242
-
243
-
244
-
245
-
246
-
247
-
248
-
249
-
250
-
251
-
252
-
253
-
254
-
255
-
256
-
257
-
258
-
259
-
260
-
261
-
262
-
263
-
264
-
265
-
266
-
267
-
268
-
269
-
270
-
271
-
272
-
273
-
274
-
275
-
276
-
277
-
278
-
279
-
280
-
281
-
282
-
283
-
284
-
285
-
286
-
287
-
288
 |
 |

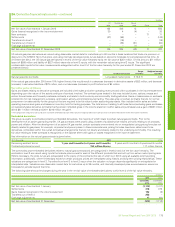
30. Pensions and other post-retirement benefits – continued
Estimated future benefit payments and the weighted average duration of defined benefit obligations
The expected benefit payments, which reflect expected future service, as appropriate, but exclude plan expenses, up until 2023 and the weighted
average duration of the defined benefit obligations at the end of the reporting period are as follows:
$ million
Estimated future benefit payments
UK
pension
plans
US
pension
plans
US
other post-
retirement
benefit
plans Other plans Total
2014 1,153 690 174 596 2,613
2015 1,201 715 177 585 2,678
2016 1,265 726 178 582 2,751
2017 1,281 733 178 570 2,762
2018 1,361 735 178 560 2,834
2019-2023 7,282 3,533 874 2,651 14,340
years
Weighted average duration 17.6 8.3 10.5 13.2
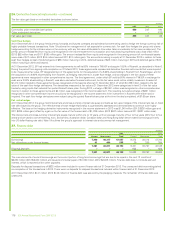
31. Called-up share capital
The allotted, called up and fully paid share capital at 31 December was as follows:
2013 2012 2011
Issued
Shares
thousand $ million
Shares
thousand $ million
Shares
thousand $ million
8% cumulative first preference shares of £1 eacha7,233 12 7,233 12 7,233 12
9% cumulative second preference shares of £1 eacha5,473 9 5,473 9 5,473 9
21 21 21
Ordinary shares of 25 cents each
At 1 January 20,959,159 5,240 20,813,410 5,203 20,647,160 5,162
Issue of new shares for the scrip dividend programme 202,124 51 138,406 35 165,601 41
Issue of new shares for employee share-based payment plansb18,203 5 7,343 2 649 –
Repurchase of ordinary share capitalc(752,854) (188) –– ––
At 31 December 20,426,632 5,108 20,959,159 5,240 20,813,410 5,203
5,129 5,261 5,224
aThe nominal amount of 8% cumulative first preference shares and 9% cumulative second preference shares that can be in issue at any time shall not exceed £10,000,000 for each class of preference
shares.
bThe nominal value of new shares issued for the employee share plans in 2011 amounted to $162,000. Consideration received relating to the issue of new shares for employee share plans amounted to
$116 million (2012 $47 million and 2011 $4 million).
cPurchased for a total consideration of $5,493 million, including transaction costs of $30 million. All shares purchased were for cancellation. The repurchased shares represented 3.6% of ordinary share
capital.
Voting on substantive resolutions tabled at a general meeting is on a poll. On a poll, shareholders present in person or by proxy have two votes for
every £5 in nominal amount of the first and second preference shares held and one vote for every ordinary share held. On a show-of-hands vote on
other resolutions (procedural matters) at a general meeting, shareholders present in person or by proxy have one vote each.
In the event of the winding up of the company, preference shareholders would be entitled to a sum equal to the capital paid up on the preference shares,
plus an amount in respect of accrued and unpaid dividends and a premium equal to the higher of (i) 10% of the capital paid up on the preference shares and
(ii) the excess of the average market price of such shares on the London Stock Exchange during the previous six months over par value.
During 2013 the company repurchased 753 million ordinary shares at a cost of $5,463 million as part of the share repurchase programme announced
on 22 March 2013. The number of shares in issue is reduced when shares are repurchased, but is not reduced in respect of the year-end commitment
to repurchase shares subsequent to the end of the year, for which an amount of $1,430 million has been accrued at 31 December 2013 (2012 nil).
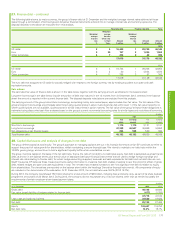
Treasury shares
2013 2012 2011
Shares
thousand
Nominal value
$ million
Shares
thousand
Nominal value
$ million
Shares
thousand
Nominal value
$ million
At 1 January 1,823,408 455 1,837,508 459 1,850,699 462
Shares re-issued for employee share-based payment plans (35,469) (8) (14,100) (4) (13,191) (3)
At 31 December 1,787,939 447 1,823,408 455 1,837,508 459
For each year presented, the balance at 1 January represents the maximum number of shares held in treasury during the year, representing 8.7%
(2012 8.8% and 2011 9.0%) of the called-up ordinary share capital of the company.
During 2013, the movement in treasury shares represented less than 0.2% (2012 less than 0.1% and 2011 less than 0.1%) of the ordinary share
capital of the company.
Financial statements
BP Annual Report and Form 20-F 2013 185