BP 2013 Annual Report Download - page 104
Download and view the complete annual report
Please find page 104 of the 2013 BP annual report below. You can navigate through the pages in the report by either clicking on the pages listed below, or by using the keyword search tool below to find specific information within the annual report.-
 1
1 -
2
-
3
-
4
-
5
-
6
-
7
-
8
-
9
-
10
-
11
-
12
-
13
-
14
-
15
-
16
-
17
-
18
-
19
-
20
-
21
-
22
-
23
-
24
-
25
-
26
-
27
-
28
-
29
-
30
-
31
-
32
-
33
-
34
-
35
-
36
-
37
-
38
-
39
-
40
-
41
-
42
-
43
-
44
-
45
-
46
-
47
-
48
-
49
-
50
-
51
-
52
-
53
-
54
-
55
-
56
-
57
-
58
-
59
-
60
-
61
-
62
-
63
-
64
-
65
-
66
-
67
-
68
-
69
-
70
-
71
-
72
-
73
-
74
-
75
-
76
-
77
-
78
-
79
-
80
-
81
-
82
-
83
-
84
-
85
-
86
-
87
-
88
-
89
-
90
-
91
-
92
-
93
-
 94
94 -
 95
95 -
 96
96 -
 97
97 -
 98
98 -
 99
99 -
 100
100 -
 101
101 -
 102
102 -
 103
103 -
 104
104 -
 105
105 -
 106
106 -
 107
107 -
 108
108 -
 109
109 -
 110
110 -
 111
111 -
 112
112 -
 113
113 -
 114
114 -
115
-
116
-
117
-
118
-
119
-
120
-
121
-
122
-
123
-
124
-
125
-
126
-
127
-
128
-
129
-
130
-
131
-
132
-
133
-
134
-
135
-
136
-
137
-
138
-
139
-
140
-
141
-
142
-
143
-
144
-
145
-
146
-
147
-
148
-
149
-
150
-
151
-
152
-
153
-
154
-
155
-
156
-
157
-
158
-
159
-
160
-
161
-
162
-
163
-
164
-
165
-
166
-
167
-
168
-
169
-
170
-
171
-
172
-
173
-
174
-
175
-
176
-
177
-
178
-
179
-
180
-
181
-
182
-
183
-
184
-
185
-
186
-
187
-
188
-
189
-
190
-
191
-
192
-
193
-
194
-
195
-
196
-
197
-
198
-
199
-
200
-
201
-
202
-
203
-
204
-
205
-
206
-
207
-
208
-
209
-
210
-
211
-
212
-
213
-
214
-
215
-
216
-
217
-
218
-
219
-
220
-
221
-
222
-
223
-
224
-
225
-
226
-
227
-
228
-
229
-
230
-
231
-
232
-
233
-
234
-
235
-
236
-
237
-
238
-
239
-
240
-
241
-
242
-
243
-
244
-
245
-
246
-
247
-
248
-
249
-
250
-
251
-
252
-
253
-
254
-
255
-
256
-
257
-
258
-
259
-
260
-
261
-
262
-
263
-
264
-
265
-
266
-
267
-
268
-
269
-
270
-
271
-
272
-
273
-
274
-
275
-
276
-
277
-
278
-
279
-
280
-
281
-
282
-
283
-
284
-
285
-
286
-
287
-
288
 |
 |

BP Annual Report and Form 20-F 2013100
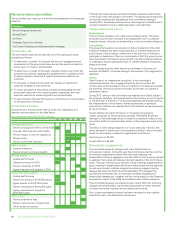
Remuneration policy in more depth
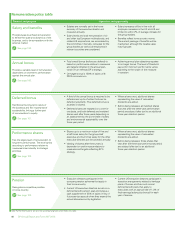
Salary and benefits
At 1 January 2014, the annual salaries for executive directors were as follows:
Bob Dudley $1,800,000, Iain Conn £774,000 and Dr Brian Gilvary £710,000.
Most components of total remuneration are determined as multiples of
salary and so the committee reviews salaries, normally annually.
These reviews consider both external competitiveness and internal
consistency when determining if any increases should be applied.
Salaries are compared against other oil majors, but the committee also
monitors market practice among European and US companies of a similar
size, geographic spread and business dynamic to BP.
Salaries are normally set in the home currency of the executive director.
The levels of increase for all our employees in relevant countries, as well as
the profile of increases for group leaders, are reviewed and considered
when assessing executive director salary increases.
The committee would expect annual increases to be in line with all
employee increases in the UK and US, unless there are promotions or
significant changes in responsibilities, in which case they would retain the
flexibility to recognize these with appropriate salary increases but will be
limited to within 2% of average increase for the group leaders.
Annual bonus
Operation
Highlights
150% of salary on target, 225% maximum.
Metrics focused on safety and operational risk,
and on value creation.
Details on performance measures will be explained each
year in annual report on remuneration.
Executive directors are eligible for an annual bonus (before any deferral) of
150% of salary at target and 225% at maximum. Bonuses for the group
chief executive and the chief financial officer will be based entirely on
group measures. Executive directors with large operating responsibilities
may have up to 50% of their bonus based on their respective business
segment, with the balance based on group measures.
The strategy provides the overall context for the company’s key
performance indicators and the focus for the annual plan. From this,
measures and targets to reflect the key priorities of the business are
selected at the start of the year for senior managers, including executive
directors. Measures typically include a range of financial and operating
ones as well as those relating to safety and the environment.
Where possible, the committee uses quantifiable, hard targets that can be
factually measured and objectively assessed. Where it is appropriate to
use qualitative measures, the information used to make assessments will
be established at the start of or early in the year. Targets are set so that
achieving plan levels of performance results in on-target bonus. For
maximum levels, targets reflect performance levels that the committee
judges are very stretching but nonetheless achievable.
At the end of each year, performance is assessed relative to the measures
and targets established at the start of the year, adjusted for any material
changes in the market environment (predominantly oil prices).
In addition to the specific bonus metrics, the committee also reviews the
underlying performance of the group in light of the annual plan,
competitors’ results and analysts’ reports, and seeks input from other
committees on relevant aspects. When appropriate, the committee may
make adjustments, up or down, to a straight formulaic result based on this
fuller information. The committee considers that this informed judgement
is important to establishing a fair overall assessment.
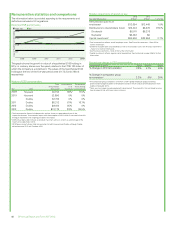
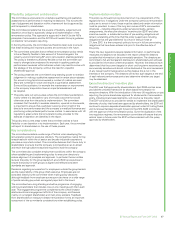
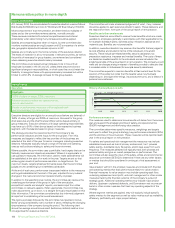
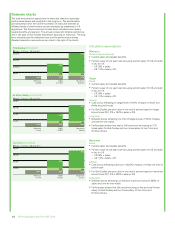
The rigorous process followed by the committee has resulted in bonus
levels varying considerably over a number of years, reflecting the changing
circumstances of the company during the period. The following chart
shows the average annual bonus result (before any deferral) relative to an
on-target level for executive directors.
History of annual bonus results
2008 2009 2010 2011 2012 2013
200
150
100
50
On-target Average actual result
% of target
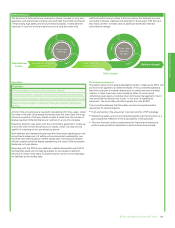
Performance measures
The measures used to determine bonus results will derive from the annual
plan and support the strategic priorities of safety and operational risk
(S&OR) management and reinforcing value creation.
The committee determines specific measures, weightings and targets
each year to reflect the group’s strategy, key performance indicators (KPIs)
and the priorities in the annual plan. These measures will be reported each
year in the annual report on remuneration.
For safety and operational risk management the measures may include
established ones such as loss of primary containment, tier 1 process
safety events, recordable injury frequency, and/or days away from work
frequency. The measures selected will typically track both process and
personal safety and give an overall perspective on performance. The
committee will also seek the input of the safety, ethics and environmental
assurance committee (SEEAC) to determine if there are any other factors
or metrics that should be considered in arriving at a final assessment at
year end.
Value creation will form the principal measures and include both financial
and operating metrics that track performance relative to value creation.
Financial measures for value creation may include operating cash flow,
underlying replacement cost profit, and cost management or other similar
measures tracking the financial outcome of the company’s pursuit of
strategic goals. Additional operating metrics may include major project
delivery, Upstream unplanned deferrals, and Downstream net income per
barrel or other similar measures that track key operating aspects of the
strategy.
Where segment metrics are applied, they will typically include specific
safety metrics for the segment as well as value metrics such as availability,
efficiency, profitability and major project delivery.
The committee will make a balanced judgement of what, if any, increase
should be applied to each executive director’s salary. These decisions, and
the reasons for them, form part of the annual report of remuneration.
Benefits and other emoluments
Executive directors are entitled to receive those benefits which are made
available to employees generally in accordance with their applicable terms,
for example sharesave plans, sickness policy, relocation assistance and
maternity pay. Benefits are not pensionable.
In addition, executive directors may receive other benefits that are judged to
be cost effective and prudent in terms of the individual’s time and/or
security. These include car-related benefits, security assistance, tax
preparation assistance, insurance and medical benefits. The costs of these
are treated as taxable benefits to the individuals and are included in the
single figure table of the annual report on remuneration. The company would
meet any tax charges arising in respect of benefits provided to directors that
it considers relate to its business (for example security assistance).
The committee expects to maintain benefits at their current level for the
duration of this policy but notes that the taxable value may fluctuate
depending on, amongst other things, insurance premiums, and a director’s
personal circumstances.