BP 2013 Annual Report Download - page 165
Download and view the complete annual report
Please find page 165 of the 2013 BP annual report below. You can navigate through the pages in the report by either clicking on the pages listed below, or by using the keyword search tool below to find specific information within the annual report.-
 1
1 -
2
-
3
-
4
-
5
-
6
-
7
-
8
-
9
-
10
-
11
-
12
-
13
-
14
-
15
-
16
-
17
-
18
-
19
-
20
-
21
-
22
-
23
-
24
-
25
-
26
-
27
-
28
-
29
-
30
-
31
-
32
-
33
-
34
-
35
-
36
-
37
-
38
-
39
-
40
-
41
-
42
-
43
-
44
-
45
-
46
-
47
-
48
-
49
-
50
-
51
-
52
-
53
-
54
-
55
-
56
-
57
-
58
-
59
-
60
-
61
-
62
-
63
-
64
-
65
-
66
-
67
-
68
-
69
-
70
-
71
-
72
-
73
-
74
-
75
-
76
-
77
-
78
-
79
-
80
-
81
-
82
-
83
-
84
-
85
-
86
-
87
-
88
-
89
-
90
-
91
-
92
-
93
-
94
-
95
-
96
-
97
-
98
-
99
-
100
-
101
-
102
-
103
-
104
-
105
-
106
-
107
-
108
-
109
-
110
-
111
-
112
-
113
-
114
-
115
-
116
-
117
-
118
-
119
-
120
-
121
-
122
-
123
-
124
-
125
-
126
-
127
-
128
-
129
-
130
-
131
-
132
-
133
-
134
-
135
-
136
-
137
-
138
-
139
-
140
-
141
-
142
-
143
-
144
-
145
-
146
-
147
-
148
-
149
-
150
-
151
-
152
-
153
-
154
-
 155
155 -
 156
156 -
 157
157 -
 158
158 -
 159
159 -
 160
160 -
 161
161 -
 162
162 -
 163
163 -
 164
164 -
 165
165 -
 166
166 -
 167
167 -
 168
168 -
 169
169 -
 170
170 -
 171
171 -
 172
172 -
 173
173 -
 174
174 -
 175
175 -
176
-
177
-
178
-
179
-
180
-
181
-
182
-
183
-
184
-
185
-
186
-
187
-
188
-
189
-
190
-
191
-
192
-
193
-
194
-
195
-
196
-
197
-
198
-
199
-
200
-
201
-
202
-
203
-
204
-
205
-
206
-
207
-
208
-
209
-
210
-
211
-
212
-
213
-
214
-
215
-
216
-
217
-
218
-
219
-
220
-
221
-
222
-
223
-
224
-
225
-
226
-
227
-
228
-
229
-
230
-
231
-
232
-
233
-
234
-
235
-
236
-
237
-
238
-
239
-
240
-
241
-
242
-
243
-
244
-
245
-
246
-
247
-
248
-
249
-
250
-
251
-
252
-
253
-
254
-
255
-
256
-
257
-
258
-
259
-
260
-
261
-
262
-
263
-
264
-
265
-
266
-
267
-
268
-
269
-
270
-
271
-
272
-
273
-
274
-
275
-
276
-
277
-
278
-
279
-
280
-
281
-
282
-
283
-
284
-
285
-
286
-
287
-
288
 |
 |

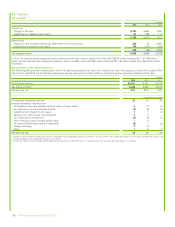
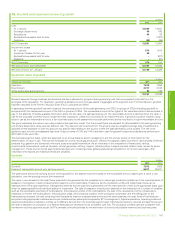
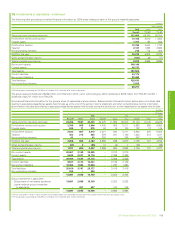
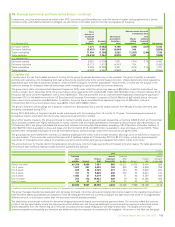
15. Goodwill and impairment review of goodwill
$ million
2013 2012
Cost
At 1 January 12,804 14,041
Exchange adjustments 46 160
Acquisitions 44 25
Reclassified as assets held for sale –(1,327)
Deletions (43) (95)
At 31 December 12,851 12,804
Impairment losses
At 1 January 614 1,612
Impairment losses for the year 56 –
Reclassified as assets held for sale –(977)
Deletions –(21)
At 31 December 670 614
Net book amount at 31 December 12,181 12,190
Net book amount at 1 January 12,190 12,429
Impairment review of goodwill
$ million
Goodwill at 31 December 2013 2012
Upstream 7,812 7,862
Downstream 4,277 4,168
Other businesses and corporate 92 160
12,181 12,190
Goodwill acquired through business combinations has been allocated to groups of cash-generating units that are expected to benefit from the
synergies of the acquisition. For Upstream, goodwill is allocated to all oil and gas assets in aggregate at the segment level. For Downstream, goodwill
has been allocated to the Rhine fuels value chain (FVC), Lubricants and Other.
In assessing whether goodwill has been impaired, the carrying amount of the cash-generating unit (CGU) or groups of CGUs (including goodwill) is
compared with the recoverable amount of the CGU or groups of CGUs. The recoverable amount is the higher of fair value less costs to sell and value in
use. In the absence of readily available information about the fair value of a cash-generating unit, the recoverable amount is deemed to be the value in
use for the purposes of performing an impairment test of goodwill, unless this would lead to an impairment loss. If goodwill would be impaired using
value in use as the recoverable amount, a fair value less costs to sell assessment would be performed as this may lead to a higher recoverable amount.
The group calculates the value in use using a discounted cash flow model. The future cash flows are adjusted for risks specific to the cash-generating
unit and are discounted using a pre-tax discount rate. The discount rate is derived from the group’s post-tax weighted average cost of capital and is
adjusted where applicable to take into account any specific risks relating to the country where the cash-generating unit is located. The rate to be
applied to each country is reassessed each year. Discount rates of 12% and 14% have been used for goodwill impairment calculations performed in
2013 (2012 12% and 14%).
The business segment plans, which are approved on an annual basis by senior management, are the primary source of information for the
determination of value in use. They contain forecasts for oil and natural gas production, refinery throughputs, sales volumes for various types of refined
products (e.g. gasoline and lubricants), revenues, costs and capital expenditure. As an initial step in the preparation of these plans, various
environmental assumptions, such as oil prices, natural gas prices, refining margins, refined product margins and cost inflation rates, are set by senior
management. These environmental assumptions take account of existing prices, global supply-demand equilibrium for oil and natural gas, other
macroeconomic factors and historical trends and variability.
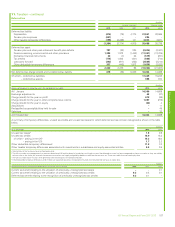
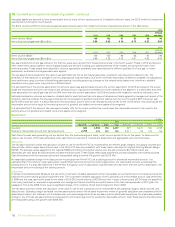
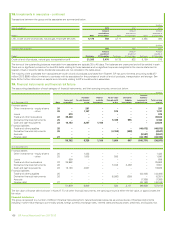
Upstream
$ million
2013 2012
Goodwill 7,812 7,862
Excess of recoverable amount over carrying amount 6,811 25,871
The table above shows the carrying amount of the goodwill for the segment and the excess of the recoverable amount, based upon a value in use
calculation, over the carrying amount (the headroom).
The value in use is based on the cash flows expected to be generated by the projected oil or natural gas production profiles up to the expected dates of
cessation of production of each producing field, based on current estimates of reserves. As the production profile and related cash flows can be
estimated from BP’s past experience, management believes that the cash flows generated over the estimated life of field is the appropriate basis upon
which to assess goodwill and individual assets for impairment. The date of cessation of production depends on the interaction of a number of variables,
such as the recoverable quantities of hydrocarbons, the production profile of the hydrocarbons, the cost of the development of the infrastructure
necessary to recover the hydrocarbons, the production costs, the contractual duration of the production concession and the selling price of the
hydrocarbons produced. As each producing field has specific reservoir characteristics and economic circumstances, the cash flows of the fields are
computed using appropriate individual economic models and key assumptions agreed by BP’s management. Capital expenditure, operating costs and
expected hydrocarbon production profiles up to 2023 are derived from the business segment plan. Estimated production volumes and cash flows up to
the date of cessation of production on a field-by-field basis are developed to be consistent with this. The production profiles used are consistent with
the reserve volumes approved as part of BP’s centrally controlled process for the estimation of proved and probable reserves and total resources.
Financial statements
BP Annual Report and Form 20-F 2013 161