BP 2013 Annual Report Download - page 95
Download and view the complete annual report
Please find page 95 of the 2013 BP annual report below. You can navigate through the pages in the report by either clicking on the pages listed below, or by using the keyword search tool below to find specific information within the annual report.-
 1
1 -
2
-
3
-
4
-
5
-
6
-
7
-
8
-
9
-
10
-
11
-
12
-
13
-
14
-
15
-
16
-
17
-
18
-
19
-
20
-
21
-
22
-
23
-
24
-
25
-
26
-
27
-
28
-
29
-
30
-
31
-
32
-
33
-
34
-
35
-
36
-
37
-
38
-
39
-
40
-
41
-
42
-
43
-
44
-
45
-
46
-
47
-
48
-
49
-
50
-
51
-
52
-
53
-
54
-
55
-
56
-
57
-
58
-
59
-
60
-
61
-
62
-
63
-
64
-
65
-
66
-
67
-
68
-
69
-
70
-
71
-
72
-
73
-
74
-
75
-
76
-
77
-
78
-
79
-
80
-
81
-
82
-
83
-
84
-
 85
85 -
 86
86 -
 87
87 -
 88
88 -
 89
89 -
 90
90 -
 91
91 -
 92
92 -
 93
93 -
 94
94 -
 95
95 -
 96
96 -
 97
97 -
 98
98 -
 99
99 -
 100
100 -
 101
101 -
 102
102 -
 103
103 -
 104
104 -
 105
105 -
106
-
107
-
108
-
109
-
110
-
111
-
112
-
113
-
114
-
115
-
116
-
117
-
118
-
119
-
120
-
121
-
122
-
123
-
124
-
125
-
126
-
127
-
128
-
129
-
130
-
131
-
132
-
133
-
134
-
135
-
136
-
137
-
138
-
139
-
140
-
141
-
142
-
143
-
144
-
145
-
146
-
147
-
148
-
149
-
150
-
151
-
152
-
153
-
154
-
155
-
156
-
157
-
158
-
159
-
160
-
161
-
162
-
163
-
164
-
165
-
166
-
167
-
168
-
169
-
170
-
171
-
172
-
173
-
174
-
175
-
176
-
177
-
178
-
179
-
180
-
181
-
182
-
183
-
184
-
185
-
186
-
187
-
188
-
189
-
190
-
191
-
192
-
193
-
194
-
195
-
196
-
197
-
198
-
199
-
200
-
201
-
202
-
203
-
204
-
205
-
206
-
207
-
208
-
209
-
210
-
211
-
212
-
213
-
214
-
215
-
216
-
217
-
218
-
219
-
220
-
221
-
222
-
223
-
224
-
225
-
226
-
227
-
228
-
229
-
230
-
231
-
232
-
233
-
234
-
235
-
236
-
237
-
238
-
239
-
240
-
241
-
242
-
243
-
244
-
245
-
246
-
247
-
248
-
249
-
250
-
251
-
252
-
253
-
254
-
255
-
256
-
257
-
258
-
259
-
260
-
261
-
262
-
263
-
264
-
265
-
266
-
267
-
268
-
269
-
270
-
271
-
272
-
273
-
274
-
275
-
276
-
277
-
278
-
279
-
280
-
281
-
282
-
283
-
284
-
285
-
286
-
287
-
288
 |
 |

Corporate governance
BP Annual Report and Form 20-F 2013 91
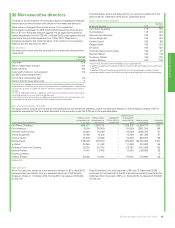
Second, a more stringent vesting schedule has been introduced for those
metrics in the performance share plan that are based on performance
relative to the other oil majors.
Third, a specific review of performance share plan outcomes will take
place to ensure high levels of vesting are consistent with shareholder
benefits. These are explained in more detail in the policy report.
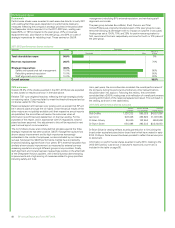
The shareholder vote from the 2013 AGM is shown below. Total votes
withheld represent less than 1% of total shares outstanding.
2013 AGM directors’ remuneration report vote results
Year % vote ‘for’ % vote ‘against’ Votes withheld
2013 94.1% 5.9% 108,843,360
Directors’ shareholdings
Executive directors are required to develop a personal shareholding of five
times salary within a reasonable period of time from appointment. It is the
stated intention of the policy that executive directors build this level of
personal shareholding primarily by retaining those shares that vest in the
deferred bonus and performance share plans which are part of the EDIP.
In assessing whether the requirement has been met, the committee takes
account of the factors it considers appropriate, including promotions and
vesting levels of these share plans, as well as any abnormal share price
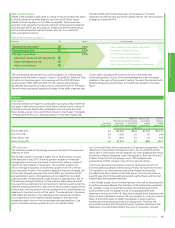
fluctuations. The table below shows the status of each of the executive
directors in developing this level. These figures include the value as at
24 February 2014 from the directors’ interests shown below plus the
assumed vesting of the 2011-2013 performance shares and is consistent
with the figures reported in the single figure table on page 85.
Appointment date
Value of current
shareholding
% of policy
achieved
Bob Dudley October 2010 $5,477,092 61%
Iain Conn July 2004 £3,888,423 101%
Dr Brian Gilvary January 2012 £2,502,388 71%
The committee is satisfied that all executive directors comply with the
policy by building the required personal shareholding in a reasonable period
of time following their appointment. Importantly, none of the existing
executive directors has sold shares that vested from the EDIP.
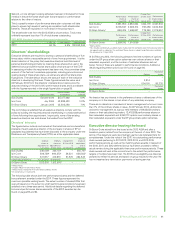
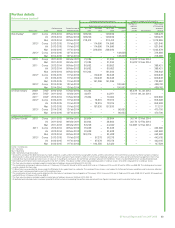
Directors’ interests
The figures below indicate and include all the beneficial and non-beneficial
interests of each executive director of the company in shares of BP (or
calculated equivalents) that have been disclosed to the company under the
Disclosure and Transparency Rules (DTRs) as at the applicable dates.
Ordinary
shares or
equivalents at
1 Jan 2013
Ordinary
shares or
equivalents at
31 Dec 2013
Change from
31 Dec 2013
to
24 Feb 2014
Ordinary
shares or
equivalents
total at
24 Feb 2014
Bob Dudley 346,008a355,707a–355,707a
Iain Conn 509,729b600,272b26,231 626,503b
Dr Brian Gilvary 331,977 412,973 81,570 494,543
Former executive director At 1 Jan 2013 At retirement
Dr Byron Grote 1,512,616c1,512,616d– –
a
Held as ADSs.
b
Includes 48,024 shares held as ADSs.
c
Held as ADSs, except for 94 shares held as ordinary shares.
d
On retirement at 11 April 2013.
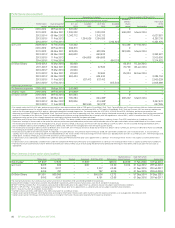
The following table shows both the performance shares and the deferred
bonus element awarded under the EDIP. These figures represent the
maximum possible vesting levels. The actual number of shares/ADSs that
vest will depend on the extent to which performance conditions have been
satisfied over a three-year period. Additional details regarding the deferred
bonus and performance shares elements of the EDIP awarded can be
found on pages 93 and 94.
Performance
shares at
1 Jan 2013
Performance
shares at
31 Dec 2013
Change from
31 Dec 2013
to
24 Feb 2014
Performance
shares total at
24 Feb 2014
Bob Dudleya3,691,950 4,953,654 1,604,178 6,557,832
Iain Conn 2,305,847 2,666,314 818,486 3,484,800
Dr Brian Gilvaryb669,434 1,599,607 776,350 2,375,957
Former executive director
Performance
shares at
1 Jan 2013
Performance
shares at
31 Dec 2013
Change from
31 Dec 2013
to
24 Feb 2014
Performance
shares total at
24 Feb 2014
Dr Byron Grotea2,889,192 1,810,686c– –
a
Held as ADSs.
b
This includes conditionally awarded shares made under the competitive performance plan prior to
his appointment as a director. The vesting of these shares is subject to performance conditions.
c On retirement at 11 April 2013.
At 24 February 2014, the following directors held the numbers of options
under the BP group share option schemes over ordinary shares or their
calculated equivalent, and the number of restricted shares as set out
below. None of these are subject to performance conditions. Additional
details regarding these options can be found on page 94.
Options
Restricted
shares
Bob Dudley – –
Iain Conn 3,814 –
Dr Brian Gilvary 504,191 80,335
Former executive director Options
Restricted
shares
Dr Byron Grote – –
No director has any interest in the preference shares or debentures of the
company or in the shares or loan stock of any subsidiary company.
There are no directors or members of senior management who own more
than 1% of the ordinary shares in issue. At 24 February 2014, all directors
and senior management as a group held interests of 9,632,638 ordinary
shares or their calculated equivalent, 12,418,589 performance shares or
their calculated equivalent and 6,058,172 options over ordinary shares or
their calculated equivalent under the BP group share option schemes.
Executive director leaving the board
Dr Byron Grote retired from the board at the 2013 AGM and after a
transition period, retired from the company at the end of June 2013. The
terms of his departure were reported last year but are reiterated here for
completeness. Under the rules of the EDIP, his outstanding performance
share awards pertaining to 2011-2013, 2012-2014, and 2013-2015
performance periods, as well as the matching share awards in respect of
the 2010, 2011 and 2012 deferred bonus have been prorated to reflect
actual service during the applicable three-year performance periods. These
share awards will vest at the normal time to the extent the performance
targets or hurdles have been met. His 2013 bonus eligibility was likewise
prorated to reflect his service and based on group results for the year. He
has not received any termination payments on leaving service.