BP 2013 Annual Report Download - page 88
Download and view the complete annual report
Please find page 88 of the 2013 BP annual report below. You can navigate through the pages in the report by either clicking on the pages listed below, or by using the keyword search tool below to find specific information within the annual report.-
 1
1 -
2
-
3
-
4
-
5
-
6
-
7
-
8
-
9
-
10
-
11
-
12
-
13
-
14
-
15
-
16
-
17
-
18
-
19
-
20
-
21
-
22
-
23
-
24
-
25
-
26
-
27
-
28
-
29
-
30
-
31
-
32
-
33
-
34
-
35
-
36
-
37
-
38
-
39
-
40
-
41
-
42
-
43
-
44
-
45
-
46
-
47
-
48
-
49
-
50
-
51
-
52
-
53
-
54
-
55
-
56
-
57
-
58
-
59
-
60
-
61
-
62
-
63
-
64
-
65
-
66
-
67
-
68
-
69
-
70
-
71
-
72
-
73
-
74
-
75
-
76
-
77
-
 78
78 -
 79
79 -
 80
80 -
 81
81 -
 82
82 -
 83
83 -
 84
84 -
 85
85 -
 86
86 -
 87
87 -
 88
88 -
 89
89 -
 90
90 -
 91
91 -
 92
92 -
 93
93 -
 94
94 -
 95
95 -
 96
96 -
 97
97 -
 98
98 -
99
-
100
-
101
-
102
-
103
-
104
-
105
-
106
-
107
-
108
-
109
-
110
-
111
-
112
-
113
-
114
-
115
-
116
-
117
-
118
-
119
-
120
-
121
-
122
-
123
-
124
-
125
-
126
-
127
-
128
-
129
-
130
-
131
-
132
-
133
-
134
-
135
-
136
-
137
-
138
-
139
-
140
-
141
-
142
-
143
-
144
-
145
-
146
-
147
-
148
-
149
-
150
-
151
-
152
-
153
-
154
-
155
-
156
-
157
-
158
-
159
-
160
-
161
-
162
-
163
-
164
-
165
-
166
-
167
-
168
-
169
-
170
-
171
-
172
-
173
-
174
-
175
-
176
-
177
-
178
-
179
-
180
-
181
-
182
-
183
-
184
-
185
-
186
-
187
-
188
-
189
-
190
-
191
-
192
-
193
-
194
-
195
-
196
-
197
-
198
-
199
-
200
-
201
-
202
-
203
-
204
-
205
-
206
-
207
-
208
-
209
-
210
-
211
-
212
-
213
-
214
-
215
-
216
-
217
-
218
-
219
-
220
-
221
-
222
-
223
-
224
-
225
-
226
-
227
-
228
-
229
-
230
-
231
-
232
-
233
-
234
-
235
-
236
-
237
-
238
-
239
-
240
-
241
-
242
-
243
-
244
-
245
-
246
-
247
-
248
-
249
-
250
-
251
-
252
-
253
-
254
-
255
-
256
-
257
-
258
-
259
-
260
-
261
-
262
-
263
-
264
-
265
-
266
-
267
-
268
-
269
-
270
-
271
-
272
-
273
-
274
-
275
-
276
-
277
-
278
-
279
-
280
-
281
-
282
-
283
-
284
-
285
-
286
-
287
-
288
 |
 |

BP Annual Report and Form 20-F 201384
2013 annual report on remuneration
This section reports on the remuneration outcomes
for 2013 and is divided into separate sections for
executive and non-executive directors.
The remuneration of the executive directors is set by
the remuneration committee (the committee) under
delegated powers from the board. The committee
makes a recommendation to the board for the
remuneration of the chairman. The remuneration of
the non-executive directors is set by the board
based on a recommendation from the chairman, the
group chief executive and the company secretary.
(a) Executive directors
Total remuneration summary
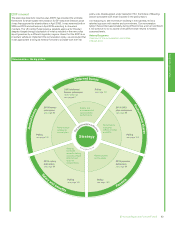
Strategy > Key performance indicators > Performance > Pay
The clear link from strategy through to pay continues. For several years the
company’s strategy has centred on enhancing safety and risk
management, rebuilding trust and restoring value. This strategy has
provided focus for key performance indicators (KPIs) and in turn the
measures for annual bonus, deferred bonus and performance share plans.
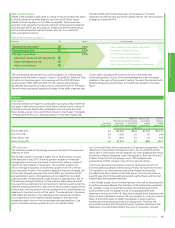
2013 summary of outcomes
These are shown in the table opposite and represent the following:
• Salary – reviewed mid-year and increased just under 3% for all except
Dr Byron Grote who retired mid-year.
• Annual bonus – overall group bonus was based 30% on safety and
operational risk (S&OR) management and 70% on restoring value.
S&OR results were good both in terms of improvement and overall
standard. Similarly, performance relative to value measures was overall
better than the annual plan. Overall group outcome was 1.32 times
target level.
The resulting cash bonuses are shown in the table opposite with total
deferred bonuses reflected in the ‘Conditional equity’ table as required
by UK regulations. Dr Byron Grote, given his retirement, was not eligible
for any deferral, and his bonus (prorated to reflect his service) was paid
in cash.
• Deferred bonus – the 2010 deferred bonus was contingent on safety
and environmental sustainability performance over the period 2011
through 2013. Overall assessment was very positive based on
continually improving safety and risk management performance and
strong evidence of ingrained safety culture and systems throughout the
organization. Based on this, 2010 deferred and matched shares
vested.
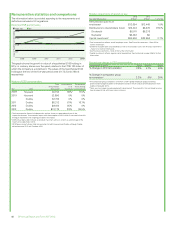
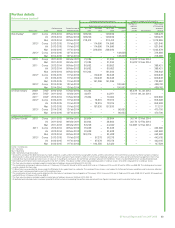
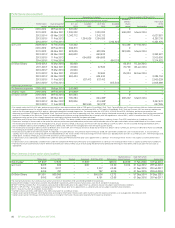
• Performance shares – the 2011-2013 plan was based 50% on total
shareholder return (TSR) and 20% on reserves replacement, both
relative to the other oil majors, and reflecting the key strategic focus on
restoring value. The final 30% was based on strategic imperatives made
up equally of safety and risk management, external reputation and staff
alignment and morale – all key strategic priorities in the period after the
Deepwater Horizon incident in 2010. 39.5% of shares in the plan are
expected to vest based on strong reserves replacement performance
and good progress against all three strategic imperatives. TSR
performance did not achieve the minimum level required for any vesting.
• Pension – pension figures reflect the UK requirements to show 20
times the increase in pension value for defined benefit schemes, as well
as any cash paid in lieu. In the case of Bob Dudley’s reported figures,
this UK requirement overstates the increase in the actuarial value of his
US pension by several million dollars.
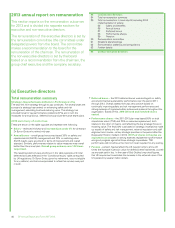
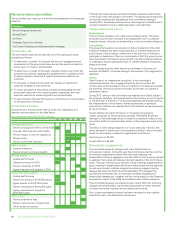
84 (a) Executive directors
84 Total remuneration summary
86 Total remuneration in more depth (including 2014
implementation of policy)
86 Salary and benefits
86 Annual bonus
87 Deferred bonus
88 Performance shares
89 Pension
90 Remuneration committee
91 Directors shareholdings
92 Remuneration statistics and comparisons
93 Further details
95 (b) Non-executive directors