BP 2013 Annual Report Download - page 167
Download and view the complete annual report
Please find page 167 of the 2013 BP annual report below. You can navigate through the pages in the report by either clicking on the pages listed below, or by using the keyword search tool below to find specific information within the annual report.-
 1
1 -
2
-
3
-
4
-
5
-
6
-
7
-
8
-
9
-
10
-
11
-
12
-
13
-
14
-
15
-
16
-
17
-
18
-
19
-
20
-
21
-
22
-
23
-
24
-
25
-
26
-
27
-
28
-
29
-
30
-
31
-
32
-
33
-
34
-
35
-
36
-
37
-
38
-
39
-
40
-
41
-
42
-
43
-
44
-
45
-
46
-
47
-
48
-
49
-
50
-
51
-
52
-
53
-
54
-
55
-
56
-
57
-
58
-
59
-
60
-
61
-
62
-
63
-
64
-
65
-
66
-
67
-
68
-
69
-
70
-
71
-
72
-
73
-
74
-
75
-
76
-
77
-
78
-
79
-
80
-
81
-
82
-
83
-
84
-
85
-
86
-
87
-
88
-
89
-
90
-
91
-
92
-
93
-
94
-
95
-
96
-
97
-
98
-
99
-
100
-
101
-
102
-
103
-
104
-
105
-
106
-
107
-
108
-
109
-
110
-
111
-
112
-
113
-
114
-
115
-
116
-
117
-
118
-
119
-
120
-
121
-
122
-
123
-
124
-
125
-
126
-
127
-
128
-
129
-
130
-
131
-
132
-
133
-
134
-
135
-
136
-
137
-
138
-
139
-
140
-
141
-
142
-
143
-
144
-
145
-
146
-
147
-
148
-
149
-
150
-
151
-
152
-
153
-
154
-
155
-
156
-
 157
157 -
 158
158 -
 159
159 -
 160
160 -
 161
161 -
 162
162 -
 163
163 -
 164
164 -
 165
165 -
 166
166 -
 167
167 -
 168
168 -
 169
169 -
 170
170 -
 171
171 -
 172
172 -
 173
173 -
 174
174 -
 175
175 -
 176
176 -
 177
177 -
178
-
179
-
180
-
181
-
182
-
183
-
184
-
185
-
186
-
187
-
188
-
189
-
190
-
191
-
192
-
193
-
194
-
195
-
196
-
197
-
198
-
199
-
200
-
201
-
202
-
203
-
204
-
205
-
206
-
207
-
208
-
209
-
210
-
211
-
212
-
213
-
214
-
215
-
216
-
217
-
218
-
219
-
220
-
221
-
222
-
223
-
224
-
225
-
226
-
227
-
228
-
229
-
230
-
231
-
232
-
233
-
234
-
235
-
236
-
237
-
238
-
239
-
240
-
241
-
242
-
243
-
244
-
245
-
246
-
247
-
248
-
249
-
250
-
251
-
252
-
253
-
254
-
255
-
256
-
257
-
258
-
259
-
260
-
261
-
262
-
263
-
264
-
265
-
266
-
267
-
268
-
269
-
270
-
271
-
272
-
273
-
274
-
275
-
276
-
277
-
278
-
279
-
280
-
281
-
282
-
283
-
284
-
285
-
286
-
287
-
288
 |
 |

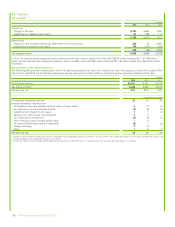
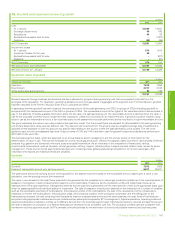
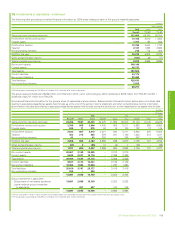
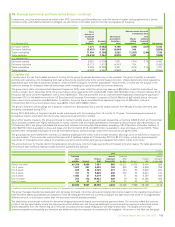
16. Intangible assets
$ million
2013 2012
Exploration
and appraisal
expenditure
Other
intangibles Total
Exploration
and appraisal
expenditure
Other
intangibles Total
Cost
At 1 January 24,511 3,739 28,250 21,216 3,500 24,716
Exchange adjustments – (5) (5) –5050
Acquisitions –––(68) 80 12
Additions 4,464 336 4,800 5,244 343 5,587
Transfers (4,365) – (4,365) (1,306) – (1,306)
Reclassified as assets held for sale –––(67) (26) (93)
Deletions (2,868) (134) (3,002) (508) (208) (716)
At 31 December 21,742 3,936 25,678 24,511 3,739 28,250
Amortization
At 1 January 1,077 2,541 3,618 783 2,280 3,063
Exchange adjustments – (2) (2) –2525
Charge for the year 2,710 267 2,977 745 317 1,062
Impairment losses 253 85 338 – 126 126
Impairment reversals –––(42) – (42)
Transfers (365) – (365) –––
Reclassified as assets held for sale ––– – (21) (21)
Deletions (2,798) (129) (2,927) (409) (186) (595)
At 31 December 877 2,762 3,639 1,077 2,541 3,618
Net book amount at 31 December 20,865 1,174 22,039 23,434 1,198 24,632
Net book amount at 1 January 23,434 1,198 24,632 20,433 1,220 21,653
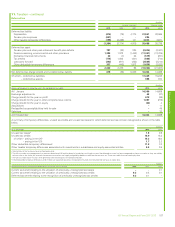
17. Investments in joint ventures
The significant joint ventures of the BP group at 31 December 2013 are shown in Note 38. Summarized financial information for the group’s share of
joint ventures is shown below. Balance sheet information shown below excludes data relating to joint ventures classified as assets held for sale as at
the end of the period. Income statement information shown below includes data relating to joint ventures reclassified as assets held for sale during the
period up until the date of reclassification. The group does not have any individually material joint ventures.
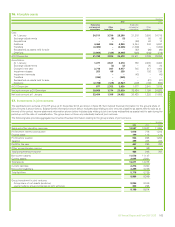
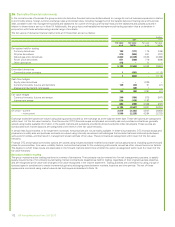
The following table provides aggregated summarized financial information relating to the group’s share of joint ventures.
$ million
2013 2012 2011
Sales and other operating revenues 12,507 12,507 11,993
Profit before interest and taxation 1,076 778 1,315
Finance costs 130 113 115
Profit before taxation 946 665 1,200
Taxation 499 405 433
Profit for the year 447 260 767
Other comprehensive income 38 (52) –
Total comprehensive income 485 208 767
Non-current assets 11,576 11,147
Current assets 3,095 2,931
Total assets 14,671 14,078
Current liabilities 2,276 2,350
Non-current liabilities 3,499 3,379
Total liabilities 5,775 5,729
8,896 8,349
Group investment in joint ventures
Group share of net assets (as above) 8,896 8,349
Loans made by group companies to joint ventures 303 265
9,199 8,614
Financial statements
BP Annual Report and Form 20-F 2013 163