BP 2013 Annual Report Download - page 17
Download and view the complete annual report
Please find page 17 of the 2013 BP annual report below. You can navigate through the pages in the report by either clicking on the pages listed below, or by using the keyword search tool below to find specific information within the annual report.-
 1
1 -
2
-
3
-
4
-
5
-
6
-
 7
7 -
 8
8 -
 9
9 -
 10
10 -
 11
11 -
 12
12 -
 13
13 -
 14
14 -
 15
15 -
 16
16 -
 17
17 -
 18
18 -
 19
19 -
 20
20 -
 21
21 -
 22
22 -
 23
23 -
 24
24 -
 25
25 -
 26
26 -
 27
27 -
28
-
29
-
30
-
31
-
32
-
33
-
34
-
35
-
36
-
37
-
38
-
39
-
40
-
41
-
42
-
43
-
44
-
45
-
46
-
47
-
48
-
49
-
50
-
51
-
52
-
53
-
54
-
55
-
56
-
57
-
58
-
59
-
60
-
61
-
62
-
63
-
64
-
65
-
66
-
67
-
68
-
69
-
70
-
71
-
72
-
73
-
74
-
75
-
76
-
77
-
78
-
79
-
80
-
81
-
82
-
83
-
84
-
85
-
86
-
87
-
88
-
89
-
90
-
91
-
92
-
93
-
94
-
95
-
96
-
97
-
98
-
99
-
100
-
101
-
102
-
103
-
104
-
105
-
106
-
107
-
108
-
109
-
110
-
111
-
112
-
113
-
114
-
115
-
116
-
117
-
118
-
119
-
120
-
121
-
122
-
123
-
124
-
125
-
126
-
127
-
128
-
129
-
130
-
131
-
132
-
133
-
134
-
135
-
136
-
137
-
138
-
139
-
140
-
141
-
142
-
143
-
144
-
145
-
146
-
147
-
148
-
149
-
150
-
151
-
152
-
153
-
154
-
155
-
156
-
157
-
158
-
159
-
160
-
161
-
162
-
163
-
164
-
165
-
166
-
167
-
168
-
169
-
170
-
171
-
172
-
173
-
174
-
175
-
176
-
177
-
178
-
179
-
180
-
181
-
182
-
183
-
184
-
185
-
186
-
187
-
188
-
189
-
190
-
191
-
192
-
193
-
194
-
195
-
196
-
197
-
198
-
199
-
200
-
201
-
202
-
203
-
204
-
205
-
206
-
207
-
208
-
209
-
210
-
211
-
212
-
213
-
214
-
215
-
216
-
217
-
218
-
219
-
220
-
221
-
222
-
223
-
224
-
225
-
226
-
227
-
228
-
229
-
230
-
231
-
232
-
233
-
234
-
235
-
236
-
237
-
238
-
239
-
240
-
241
-
242
-
243
-
244
-
245
-
246
-
247
-
248
-
249
-
250
-
251
-
252
-
253
-
254
-
255
-
256
-
257
-
258
-
259
-
260
-
261
-
262
-
263
-
264
-
265
-
266
-
267
-
268
-
269
-
270
-
271
-
272
-
273
-
274
-
275
-
276
-
277
-
278
-
279
-
280
-
281
-
282
-
283
-
284
-
285
-
286
-
287
-
288
 |
 |

Strategic report
Financial discipline
$
Time
(Not to scale)
Free cash flow
Operating cash flow
Net investment
Our goal is to be a focused oil and gas company that
delivers value over volume.
Our strategy
We are pursuing our strategy by setting clear
priorities, actively managing a quality portfolio
and employing our distinctive capabilities. Our
financial objective is to create shareholder value
by generating sustainable free cash flow
(operating cash flow less net investment). This
disciplined approach enables us to invest for the
future while aiming to increase distributions to
our investors.
Clear priorities
First, we aim to run safe, reliable and compliant
operations – leading to better operational
efficiency and safety performance. We also aim
to achieve competitive project execution, which
is about delivering projects efficiently so they are
on time and on budget. And we aim to make
disciplined financial choices, so we can achieve
continued growth in operating cash from our
underlying businesses and disciplined allocation
of capital.
Quality portfolio
We undertake active portfolio management to
concentrate on areas where we can play to our
strengths. This means we continue to grow our
exploration position, reloading our upstream
pipeline. We focus on high-value upstream
assets in deepwater, giant fields and selected
gas value chains. And, with our downstream
businesses, we plan to leverage our newly
upgraded assets, customer relationships and
technology to grow free cash flow.
Our portfolio of projects and operations is
focused where we can generate the most value,
and not necessarily the most volume, through
our production.
Distinctive capabilities
Our ability to deliver against our priorities and
build the right portfolio depends on our
distinctive capabilities. We apply advanced
technology across the hydrocarbon value chain,
from finding resources to developing energy-
efficient and high-performance products for
customers. We rely on our strong relationships
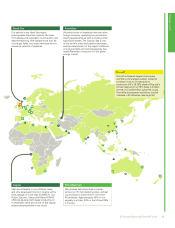
– with governments, partners, civil society and
others – to enable our operations in around 80
countries across the globe. And, the proven
expertise of our employees comes to the fore
in a wide range of disciplines.
Our strategy in action
See page 14 for more information
on how we are going to measure our
progress.
1 A relentless focus on safety and managing
risk through the systematic application of
global standards.
2 We will play to our strengths in exploration,
deep water, giant fields and gas value chains.
3 Stronger and more focused with an asset
base that is high graded and higher
performing.
4 Simpler and more standardized with fewer
assets and operations in fewer countries;
more streamlined internal reward and
performance management processes.
5 Improved transparency through reporting
TNK-BP as a separate segment and breaking
out the numbers for the three downstream
businesses.
6 Active portfolio management to continue
by completing $38 billion of disposals over
the four years to the end of 2013, in order
to focus on our strengths.
7 We expect to bring new upstream projects
onstream with unit operating cash marginsf
around double the 2011 average by 2014.g
8 We are aiming to generate an increase
of around 50% in net cash provided by
operating activities by 2014 compared
with 2011.h
9 We intend to use half our incremental
operating cash for reinvestment, half for
other purposes.
10 Strong balance sheet with intention to
target our level of gearingi in the lower
half of the 10-20% range over time.
a See footnote a on page 56.
b Equivalent to net cash used in investing activities.
c See footnote c on page 56.
d See footnote h on page 24.
e Excludes acquisitions and asset exchanges.
f Unit cash margin is net cash provided by operating activities by
the relevant projects in our Upstream segment, divided by the
total number of barrels of oil equivalent produced for the relevant
projects.
g Assuming a constant oil price of $100 per barrel.
h See footnote b on page 56.
i See footnote d on page 56.
10-point plan 2011-2014
In 2011 we laid out a 10-point plan designed to stabilize the company and restore trust and value in
response to the tragic Deepwater Horizon accident. Our priority was to make BP a safer, more
risk-aware business. The plan included a series of milestones by which our progress could be
tracked, from 2012 through to 2014. Information on our progress during 2013 can be found in Group
performance on page 22.
• Operating cash flow – we aim to continue
growing our operating cash flow, with an
expected delivery of $30 billion to $31
billion in 2014.d
• Capital expenditure – we expect our
annual capital expendituree to remain
between $24 billion and $25 billion in 2014
and to be in the range of $24 billion to
$26 billion in the years 2015 to 2018.
• Divestments – we intend to divest
$10 billion of assets before the end of 2015.
• Free cash flow – delivering sustainable free
cash flow underpins our ability to deliver
increasing shareholder returns.
This chart illustrates the expected relationship
between operating cash flowa, net investmentb
(includes capital expenditure offset by any
divestments) and free cash flowc. It is not a
projection of future performance.
BP Annual Report and Form 20-F 2013 13