BP 2013 Annual Report Download - page 185
Download and view the complete annual report
Please find page 185 of the 2013 BP annual report below. You can navigate through the pages in the report by either clicking on the pages listed below, or by using the keyword search tool below to find specific information within the annual report.-
 1
1 -
2
-
3
-
4
-
5
-
6
-
7
-
8
-
9
-
10
-
11
-
12
-
13
-
14
-
15
-
16
-
17
-
18
-
19
-
20
-
21
-
22
-
23
-
24
-
25
-
26
-
27
-
28
-
29
-
30
-
31
-
32
-
33
-
34
-
35
-
36
-
37
-
38
-
39
-
40
-
41
-
42
-
43
-
44
-
45
-
46
-
47
-
48
-
49
-
50
-
51
-
52
-
53
-
54
-
55
-
56
-
57
-
58
-
59
-
60
-
61
-
62
-
63
-
64
-
65
-
66
-
67
-
68
-
69
-
70
-
71
-
72
-
73
-
74
-
75
-
76
-
77
-
78
-
79
-
80
-
81
-
82
-
83
-
84
-
85
-
86
-
87
-
88
-
89
-
90
-
91
-
92
-
93
-
94
-
95
-
96
-
97
-
98
-
99
-
100
-
101
-
102
-
103
-
104
-
105
-
106
-
107
-
108
-
109
-
110
-
111
-
112
-
113
-
114
-
115
-
116
-
117
-
118
-
119
-
120
-
121
-
122
-
123
-
124
-
125
-
126
-
127
-
128
-
129
-
130
-
131
-
132
-
133
-
134
-
135
-
136
-
137
-
138
-
139
-
140
-
141
-
142
-
143
-
144
-
145
-
146
-
147
-
148
-
149
-
150
-
151
-
152
-
153
-
154
-
155
-
156
-
157
-
158
-
159
-
160
-
161
-
162
-
163
-
164
-
165
-
166
-
167
-
168
-
169
-
170
-
171
-
172
-
173
-
174
-
 175
175 -
 176
176 -
 177
177 -
 178
178 -
 179
179 -
 180
180 -
 181
181 -
 182
182 -
 183
183 -
 184
184 -
 185
185 -
 186
186 -
 187
187 -
 188
188 -
 189
189 -
 190
190 -
 191
191 -
 192
192 -
 193
193 -
 194
194 -
 195
195 -
196
-
197
-
198
-
199
-
200
-
201
-
202
-
203
-
204
-
205
-
206
-
207
-
208
-
209
-
210
-
211
-
212
-
213
-
214
-
215
-
216
-
217
-
218
-
219
-
220
-
221
-
222
-
223
-
224
-
225
-
226
-
227
-
228
-
229
-
230
-
231
-
232
-
233
-
234
-
235
-
236
-
237
-
238
-
239
-
240
-
241
-
242
-
243
-
244
-
245
-
246
-
247
-
248
-
249
-
250
-
251
-
252
-
253
-
254
-
255
-
256
-
257
-
258
-
259
-
260
-
261
-
262
-
263
-
264
-
265
-
266
-
267
-
268
-
269
-
270
-
271
-
272
-
273
-
274
-
275
-
276
-
277
-
278
-
279
-
280
-
281
-
282
-
283
-
284
-
285
-
286
-
287
-
288
 |
 |

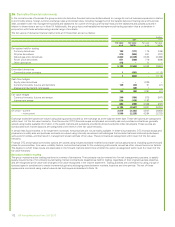
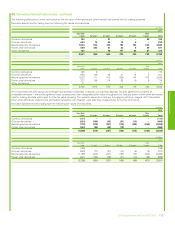
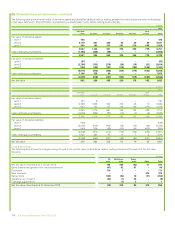
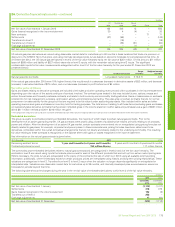
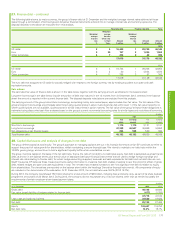
30. Pensions and other post-retirement benefits – continued
The fair values of the various categories of assets held by the defined benefit plans at 31 December are presented in the table below, including the
effects of derivative financial instruments. Movements in the fair value of plan assets during the year are shown in detail in the table on page 182.
$ million
UK
pension
plansa
US
pension
plansb
US other
post-
retirement
benefit
plans
Other
plans Total
Fair value of pension plan assets
At 31 December 2013
Listed equities – developed markets 17,341 3,260 – 913 21,514
– emerging markets 2,290 308 – 84 2,682
Private equity 2,907 1,432 – 6 4,345
Government issued nominal bonds 549 1,259 – 1,258 3,066
Index-linked bonds 787 – – 69 856
Corporate bonds 4,427 1,323 – 982 6,732
Property 2,200 6 – 134 2,340
Cash 855 135 – 278 1,268
Other 160 55 – 113 328
31,516 7,778 – 3,837 43,131
At 31 December 2012
Listed equities – developed markets 15,659 3,622 – 844 20,125
– emerging markets 1,074 341 – 89 1,504
Private equity 2,879 1,468 – 7 4,354
Government issued nominal bonds 544 904 – 1,042 2,490
Index-linked bonds 491 – – 78 569
Corporate bonds 3,850 1,255 – 766 5,871
Property 1,783 5 – 139 1,927
Cash 1,000 86 1 321 1,408
Other 66 105 – 247 418
27,346 7,786 1 3,533 38,666
At 31 December 2011
Listed equities – developed markets 13,622 3,328 – 754 17,704
– emerging markets 890 299 – 69 1,258
Private equity 2,690 1,407 – 8 4,105
Government issued nominal bonds 513 733 – 993 2,239
Index-linked bonds 390 – – 123 513
Corporate bonds 3,238 1,289 – 724 5,251
Property 1,710 4 – 117 1,831
Cash 470 88 4 326 888
Other 64 56 – 172 292
23,587 7,204 4 3,286 34,081
aBonds held by the UK pension fund are typically denominated in sterling. Property held by the UK pension fund is in the United Kingdom.
bBonds held by the US pension fund are typically denominated in US dollars.
Financial statements
BP Annual Report and Form 20-F 2013 181