BP 2013 Annual Report Download - page 93
Download and view the complete annual report
Please find page 93 of the 2013 BP annual report below. You can navigate through the pages in the report by either clicking on the pages listed below, or by using the keyword search tool below to find specific information within the annual report.-
 1
1 -
2
-
3
-
4
-
5
-
6
-
7
-
8
-
9
-
10
-
11
-
12
-
13
-
14
-
15
-
16
-
17
-
18
-
19
-
20
-
21
-
22
-
23
-
24
-
25
-
26
-
27
-
28
-
29
-
30
-
31
-
32
-
33
-
34
-
35
-
36
-
37
-
38
-
39
-
40
-
41
-
42
-
43
-
44
-
45
-
46
-
47
-
48
-
49
-
50
-
51
-
52
-
53
-
54
-
55
-
56
-
57
-
58
-
59
-
60
-
61
-
62
-
63
-
64
-
65
-
66
-
67
-
68
-
69
-
70
-
71
-
72
-
73
-
74
-
75
-
76
-
77
-
78
-
79
-
80
-
81
-
82
-
 83
83 -
 84
84 -
 85
85 -
 86
86 -
 87
87 -
 88
88 -
 89
89 -
 90
90 -
 91
91 -
 92
92 -
 93
93 -
 94
94 -
 95
95 -
 96
96 -
 97
97 -
 98
98 -
 99
99 -
 100
100 -
 101
101 -
 102
102 -
 103
103 -
104
-
105
-
106
-
107
-
108
-
109
-
110
-
111
-
112
-
113
-
114
-
115
-
116
-
117
-
118
-
119
-
120
-
121
-
122
-
123
-
124
-
125
-
126
-
127
-
128
-
129
-
130
-
131
-
132
-
133
-
134
-
135
-
136
-
137
-
138
-
139
-
140
-
141
-
142
-
143
-
144
-
145
-
146
-
147
-
148
-
149
-
150
-
151
-
152
-
153
-
154
-
155
-
156
-
157
-
158
-
159
-
160
-
161
-
162
-
163
-
164
-
165
-
166
-
167
-
168
-
169
-
170
-
171
-
172
-
173
-
174
-
175
-
176
-
177
-
178
-
179
-
180
-
181
-
182
-
183
-
184
-
185
-
186
-
187
-
188
-
189
-
190
-
191
-
192
-
193
-
194
-
195
-
196
-
197
-
198
-
199
-
200
-
201
-
202
-
203
-
204
-
205
-
206
-
207
-
208
-
209
-
210
-
211
-
212
-
213
-
214
-
215
-
216
-
217
-
218
-
219
-
220
-
221
-
222
-
223
-
224
-
225
-
226
-
227
-
228
-
229
-
230
-
231
-
232
-
233
-
234
-
235
-
236
-
237
-
238
-
239
-
240
-
241
-
242
-
243
-
244
-
245
-
246
-
247
-
248
-
249
-
250
-
251
-
252
-
253
-
254
-
255
-
256
-
257
-
258
-
259
-
260
-
261
-
262
-
263
-
264
-
265
-
266
-
267
-
268
-
269
-
270
-
271
-
272
-
273
-
274
-
275
-
276
-
277
-
278
-
279
-
280
-
281
-
282
-
283
-
284
-
285
-
286
-
287
-
288
 |
 |

Corporate governance
BP Annual Report and Form 20-F 2013 89
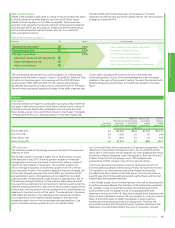
2014 implementation
Shares were awarded in early 2014 to a value of five and a half times salary
to Bob Dudley and four times salary to Iain Conn and Dr Brian Gilvary
(details of which are shown in the table on page 85). These have been
awarded under the performance share element of the executive directors’
incentive plan (EDIP) and are subject to a three-year performance period,
and for those shares that vest are subject, after tax, to an additional
three-year retention period.
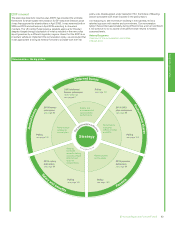
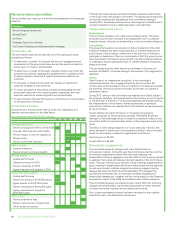
The 2014-2016 performance share plan will be based on the same
measures as used last year and remain aligned directly with the company’s
strategic priorities and KPIs.
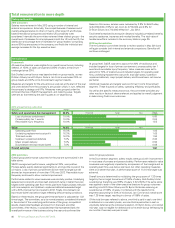
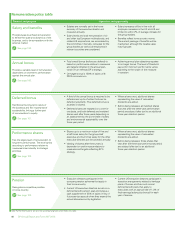
2014-2016 performance shares
Measures KPI Weight Link to strategy
Safe, reliable and compliant operations
Disciplined financial choices
Competitive project execution
Focus on high-value Upstream assets
Grow our exploration position
Build high-quality Downstream businesses
Total shareholder return 1/3rd
Operating cash flow 1/3rd
Strategic imperatives 1/3rd
Safety and operational risk management
Reserves replacement ratio
Major project delivery
TSR and reserves replacement ratio will be assessed on a relative basis
compared with the other oil majors – Chevron, ExxonMobil, Shell and Total.
As set out in the policy report, commencing with the 2014-2016 plan,
vesting will be 100%, 80% and 25% for first, second and third place
respectively amongst the oil majors and no vesting for fourth or fifth place.
The committee has agreed targets and ranges for the other measures that
will be used to assess performance at the end of the three-year
performance period. As part of its overall assessment it also considers
whether, in the event of high levels of vesting, the result is consistent with
benefits achieved by shareholders. Full details are included in the policy
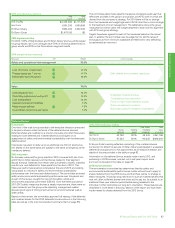
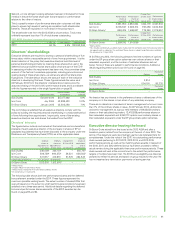
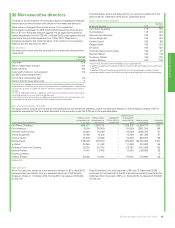
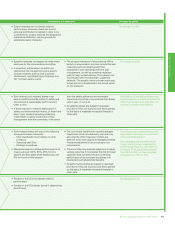
report. Pensions
Pension
Framework
Executive directors are eligible to participate in company pension schemes
that apply in their home countries which follow national norms in terms of
structure and levels. Bob Dudley participates in the US plans (as did Dr
Byron Grote), and Iain Conn and Dr Brian Gilvary in the UK plan. Full details
on these plans are set out in the policy section of this report (page 103).
Service at
31 Dec 2013
Total accrued
pension at
31 Dec 2013
Additional
pension earned
during 2013
(net of inflation)
Actuarial value
of increase
earned
during 2013
20 times
increase
earned
during 2013
(thousand)
Bob Dudley (US) 34 $2,050 $222 $1,319 $4,447
Iain Conn (UK) 28 £326 £2 £0 £46
Brian Gilvary (UK) 27 £326 £2 £0 £44
Byron Grote (US) n/a $1,416 $7 -$93 $141
2013 outcomes
The table above sets out the change in pension for each of the executive
directors for 2013.
Bob Dudley’s pension increase is largely due to his promotion to group
chief executive in late 2010. Since his pension is based on three-year
average salary and bonus, the impact of a promotion takes a number of
years to be fully reflected in his pension. He is entitled, as all former
Amoco heritage employees, to receive the greater of the BP or Amoco
plans that apply. As part of the transition agreed at the time of merger, the
Amoco plan stopped accruing at the end of 2012, and therefore the BP
plan applicable to senior US executives will now determine his overall
accrued benefit. His total benefit under this plan is calculated as 1.3% of
final average earnings (including, for this purpose, base salary plus cash
bonus and bonus deferred into a compulsory or voluntary award under the
deferred matching element) for each year of service (without regard for tax
limits) which may be paid from various qualified and non-qualified plans as
described in the policy section of this report. The calculations in the above
table reflect this transition. The calculations also incorporate the latest
bonus reported on when determining the average of the best three
successive years’ bonus in the final average earnings calculation. Last
year’s numbers have been updated to be on a consistent basis.
Iain Conn and Dr Brian Gilvary participate in UK pension arrangements. The
disclosure of total pension includes any cash in lieu of additional accrual
that is paid to individuals in the UK scheme who have exceeded the annual
allowance or lifetime allowance under UK regulations. Both Iain Conn and
Dr Brian Gilvary fall into this category and in 2013 received cash
supplements of 35% of salary in lieu of future service accrual.
In terms of calculating the increase in pension value both a column on
20 times additional pension earned during the year as required by the new
UK regulations, as well as the actuarial value increase as previously
stipulated have been included in the table above. The summary table on
page 85 uses the 20 times additional pension earned figure and the cash
supplements are separately identified.
In Bob Dudley’s case, the committee has been informed by the company’s
consulting actuaries, Mercer, that the factor of 20 substantially overstates
the increase in value of his pension benefits primarily because his US
pension benefits are not subject to cost of living adjustments after
retirement, as they are in the UK. They have indicated that a typical annuity
factor for such US benefits is around 12, as compared to a UK plan where a
factor of 20 is often taken to reflect the increase in value of pension
benefits (as well as being required by UK regulations). Therefore the
committee considers that the actuarial value of increase identified in the
table above more accurately reflects the value of his pension increase.