BP 2013 Annual Report Download - page 158
Download and view the complete annual report
Please find page 158 of the 2013 BP annual report below. You can navigate through the pages in the report by either clicking on the pages listed below, or by using the keyword search tool below to find specific information within the annual report.-
 1
1 -
2
-
3
-
4
-
5
-
6
-
7
-
8
-
9
-
10
-
11
-
12
-
13
-
14
-
15
-
16
-
17
-
18
-
19
-
20
-
21
-
22
-
23
-
24
-
25
-
26
-
27
-
28
-
29
-
30
-
31
-
32
-
33
-
34
-
35
-
36
-
37
-
38
-
39
-
40
-
41
-
42
-
43
-
44
-
45
-
46
-
47
-
48
-
49
-
50
-
51
-
52
-
53
-
54
-
55
-
56
-
57
-
58
-
59
-
60
-
61
-
62
-
63
-
64
-
65
-
66
-
67
-
68
-
69
-
70
-
71
-
72
-
73
-
74
-
75
-
76
-
77
-
78
-
79
-
80
-
81
-
82
-
83
-
84
-
85
-
86
-
87
-
88
-
89
-
90
-
91
-
92
-
93
-
94
-
95
-
96
-
97
-
98
-
99
-
100
-
101
-
102
-
103
-
104
-
105
-
106
-
107
-
108
-
109
-
110
-
111
-
112
-
113
-
114
-
115
-
116
-
117
-
118
-
119
-
120
-
121
-
122
-
123
-
124
-
125
-
126
-
127
-
128
-
129
-
130
-
131
-
132
-
133
-
134
-
135
-
136
-
137
-
138
-
139
-
140
-
141
-
142
-
143
-
144
-
145
-
146
-
147
-
 148
148 -
 149
149 -
 150
150 -
 151
151 -
 152
152 -
 153
153 -
 154
154 -
 155
155 -
 156
156 -
 157
157 -
 158
158 -
 159
159 -
 160
160 -
 161
161 -
 162
162 -
 163
163 -
 164
164 -
 165
165 -
 166
166 -
 167
167 -
 168
168 -
169
-
170
-
171
-
172
-
173
-
174
-
175
-
176
-
177
-
178
-
179
-
180
-
181
-
182
-
183
-
184
-
185
-
186
-
187
-
188
-
189
-
190
-
191
-
192
-
193
-
194
-
195
-
196
-
197
-
198
-
199
-
200
-
201
-
202
-
203
-
204
-
205
-
206
-
207
-
208
-
209
-
210
-
211
-
212
-
213
-
214
-
215
-
216
-
217
-
218
-
219
-
220
-
221
-
222
-
223
-
224
-
225
-
226
-
227
-
228
-
229
-
230
-
231
-
232
-
233
-
234
-
235
-
236
-
237
-
238
-
239
-
240
-
241
-
242
-
243
-
244
-
245
-
246
-
247
-
248
-
249
-
250
-
251
-
252
-
253
-
254
-
255
-
256
-
257
-
258
-
259
-
260
-
261
-
262
-
263
-
264
-
265
-
266
-
267
-
268
-
269
-
270
-
271
-
272
-
273
-
274
-
275
-
276
-
277
-
278
-
279
-
280
-
281
-
282
-
283
-
284
-
285
-
286
-
287
-
288
 |
 |

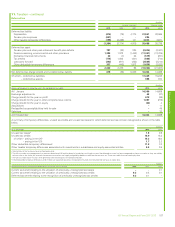
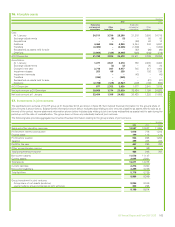
7. Segmental analysis – continued
$ million
2011
By geographical area US Non-US Total
Revenues
Third party sales and other operating revenuesa131,488 244,225 375,713
Other income statement items
Production and similar taxes 1,854 6,426 8,280
Results
Replacement cost profit before interest and taxation 10,202 26,979 37,181
Non-current assets
Other non-current assetsbc 66,523 113,323 179,846
Other investments 2,635
Loans 824
Trade and other receivables 5,738
Derivative financial instruments 5,038
Deferred tax assets 611
Defined benefit pension plan surpluses 17
Total non-current assets 194,709
Capital expenditure and acquisitions 8,931 23,028 31,959
aNon-US region includes UK $75,816 million.
bNon-US region includes UK $18,363 million.
cExcluding financial instruments, deferred tax assets and defined benefit pension plan surpluses.
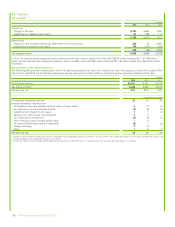
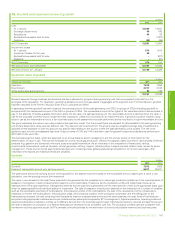
8. Income statement analysis
$ million
2013 2012 2011
Interest and other income
Interest income 282 319 244
Other incomea495 1,358 444
777 1,677 688
Currency exchange losses (gains) charged (credited) to the income statementb180 106 (69)
Expenditure on research and development 707 674 636
Finance costs
Interest payable 1,082 1,234 1,151
Capitalized at 2% (2012 2.25% and 2011 2.63%)c(238) (390) (349)
Unwinding of discount on provisionsd147 140 244
Unwinding of discount on other payablesd77 88 141
1,068 1,072 1,187
a2012 includes $709 million of dividends received from TNK-BP. See Note 6 for further information.
bExcludes exchange gains and losses arising on financial instruments measured at fair value through profit or loss.
cTax relief on capitalized interest is approximately $62 million (2012 $93 million and 2011 $107 million).
dUnwinding of discount on provisions relating to the Gulf of Mexico oil spill was $1 million (2012 $7 million and 2011 $6 million) and unwinding of discount on other payables relating to the Gulf of
Mexico oil spill was $38 million (2012 $12 million and 2011 $52 million). See Note 2 for further information on the financial impacts of the Gulf of Mexico oil spill.
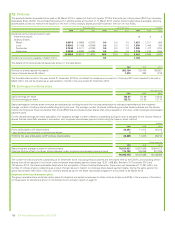
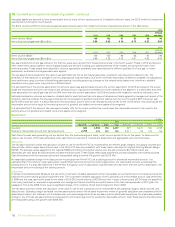
9. Operating leases
In the case of an operating lease entered into by BP as the operator of a joint operation, the amounts shown in the tables below represent the net
operating lease expense and net future minimum lease payments. These net amounts are after deducting amounts reimbursed, or to be reimbursed,
by joint operators, whether the joint operators have co-signed the lease or not. Where BP is not the operator of a joint operation, BP’s share of the
lease expense and future minimum lease payments is included in the amounts shown, whether BP has co-signed the lease or not.
The table below shows the expense for the year in respect of operating leases.
$ million
2013 2012 2011
Minimum lease payments 5,961 5,257 4,868
Contingent rentals (50) (79) (97)
Sub-lease rentals (88) (228) (153)
5,823 4,950 4,618
154 BP Annual Report and Form 20-F 2013