BP 2013 Annual Report Download - page 163
Download and view the complete annual report
Please find page 163 of the 2013 BP annual report below. You can navigate through the pages in the report by either clicking on the pages listed below, or by using the keyword search tool below to find specific information within the annual report.-
 1
1 -
2
-
3
-
4
-
5
-
6
-
7
-
8
-
9
-
10
-
11
-
12
-
13
-
14
-
15
-
16
-
17
-
18
-
19
-
20
-
21
-
22
-
23
-
24
-
25
-
26
-
27
-
28
-
29
-
30
-
31
-
32
-
33
-
34
-
35
-
36
-
37
-
38
-
39
-
40
-
41
-
42
-
43
-
44
-
45
-
46
-
47
-
48
-
49
-
50
-
51
-
52
-
53
-
54
-
55
-
56
-
57
-
58
-
59
-
60
-
61
-
62
-
63
-
64
-
65
-
66
-
67
-
68
-
69
-
70
-
71
-
72
-
73
-
74
-
75
-
76
-
77
-
78
-
79
-
80
-
81
-
82
-
83
-
84
-
85
-
86
-
87
-
88
-
89
-
90
-
91
-
92
-
93
-
94
-
95
-
96
-
97
-
98
-
99
-
100
-
101
-
102
-
103
-
104
-
105
-
106
-
107
-
108
-
109
-
110
-
111
-
112
-
113
-
114
-
115
-
116
-
117
-
118
-
119
-
120
-
121
-
122
-
123
-
124
-
125
-
126
-
127
-
128
-
129
-
130
-
131
-
132
-
133
-
134
-
135
-
136
-
137
-
138
-
139
-
140
-
141
-
142
-
143
-
144
-
145
-
146
-
147
-
148
-
149
-
150
-
151
-
152
-
 153
153 -
 154
154 -
 155
155 -
 156
156 -
 157
157 -
 158
158 -
 159
159 -
 160
160 -
 161
161 -
 162
162 -
 163
163 -
 164
164 -
 165
165 -
 166
166 -
 167
167 -
 168
168 -
 169
169 -
 170
170 -
 171
171 -
 172
172 -
 173
173 -
174
-
175
-
176
-
177
-
178
-
179
-
180
-
181
-
182
-
183
-
184
-
185
-
186
-
187
-
188
-
189
-
190
-
191
-
192
-
193
-
194
-
195
-
196
-
197
-
198
-
199
-
200
-
201
-
202
-
203
-
204
-
205
-
206
-
207
-
208
-
209
-
210
-
211
-
212
-
213
-
214
-
215
-
216
-
217
-
218
-
219
-
220
-
221
-
222
-
223
-
224
-
225
-
226
-
227
-
228
-
229
-
230
-
231
-
232
-
233
-
234
-
235
-
236
-
237
-
238
-
239
-
240
-
241
-
242
-
243
-
244
-
245
-
246
-
247
-
248
-
249
-
250
-
251
-
252
-
253
-
254
-
255
-
256
-
257
-
258
-
259
-
260
-
261
-
262
-
263
-
264
-
265
-
266
-
267
-
268
-
269
-
270
-
271
-
272
-
273
-
274
-
275
-
276
-
277
-
278
-
279
-
280
-
281
-
282
-
283
-
284
-
285
-
286
-
287
-
288
 |
 |

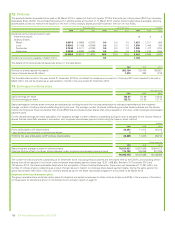
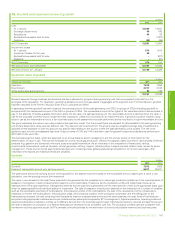
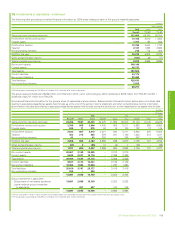
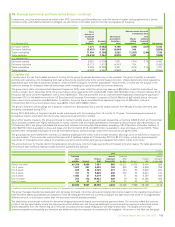
13. Earnings per ordinary share – continued
The following table shows the number of shares potentially issuable under employee share option plans, including the number of options outstanding,
the number of options exercisable at the end of each year, and the corresponding weighted average exercise prices. The dilutive effect of the
employee share option plans at 31 December included in the diluted earnings per share is also shown.
Share options 2013 2012
Number of
optionsab
thousand
Weighted
average
exercise
price $
Number of
optionsab
thousand
Weighted
average
exercise
price $
Outstanding 286,725 7.71 324,096 7.62
Exercisable 127,290 10.01 159,419 9.33
Dilutive effect 23,169 n/a 16,435 n/a
aNumbers of options shown are ordinary share equivalents (one ADS is equivalent to six ordinary shares).
bAt 31 December 2013, the quoted market price of one BP ordinary share was $8.10 (2012 $6.94).
In addition, the group operates a number of equity-settled employee share plans under which share units are granted to the group’s senior leaders and
certain other employees. These plans typically have a three-year performance or restricted period during which the units accrue net notional dividends
which are treated as having been reinvested. Leaving employment will normally preclude the conversion of units into shares, but special arrangements
apply for participants that leave for qualifying reasons. The number of shares that are expected to vest each year under employee share plans are
shown in the table below. The dilutive effect of the employee share plans at 31 December included in the diluted earnings per share is also shown.
Shares 2013 2012
Vesting
Number of
sharesa
thousand
Number of
sharesa
thousand
Within one year 35,442 29,138
1 to 2 years 120,056 67,593
2 to 3 years 115,387 120,621
3 to 4 years 14,231 25,066
4 to 5 years 123 233
285,239 242,651
Dilutive effect 95,014 95,683
aNumbers of shares shown are ordinary share equivalents (one ADS is equivalent to six ordinary shares).
There has been a net decrease of 32,378,757 in the number of potential ordinary shares in relation to employee share-based payment plans between
31 December 2013 and 18 February 2014.
Financial statements
BP Annual Report and Form 20-F 2013 159