BP 2013 Annual Report Download - page 157
Download and view the complete annual report
Please find page 157 of the 2013 BP annual report below. You can navigate through the pages in the report by either clicking on the pages listed below, or by using the keyword search tool below to find specific information within the annual report.-
 1
1 -
2
-
3
-
4
-
5
-
6
-
7
-
8
-
9
-
10
-
11
-
12
-
13
-
14
-
15
-
16
-
17
-
18
-
19
-
20
-
21
-
22
-
23
-
24
-
25
-
26
-
27
-
28
-
29
-
30
-
31
-
32
-
33
-
34
-
35
-
36
-
37
-
38
-
39
-
40
-
41
-
42
-
43
-
44
-
45
-
46
-
47
-
48
-
49
-
50
-
51
-
52
-
53
-
54
-
55
-
56
-
57
-
58
-
59
-
60
-
61
-
62
-
63
-
64
-
65
-
66
-
67
-
68
-
69
-
70
-
71
-
72
-
73
-
74
-
75
-
76
-
77
-
78
-
79
-
80
-
81
-
82
-
83
-
84
-
85
-
86
-
87
-
88
-
89
-
90
-
91
-
92
-
93
-
94
-
95
-
96
-
97
-
98
-
99
-
100
-
101
-
102
-
103
-
104
-
105
-
106
-
107
-
108
-
109
-
110
-
111
-
112
-
113
-
114
-
115
-
116
-
117
-
118
-
119
-
120
-
121
-
122
-
123
-
124
-
125
-
126
-
127
-
128
-
129
-
130
-
131
-
132
-
133
-
134
-
135
-
136
-
137
-
138
-
139
-
140
-
141
-
142
-
143
-
144
-
145
-
146
-
 147
147 -
 148
148 -
 149
149 -
 150
150 -
 151
151 -
 152
152 -
 153
153 -
 154
154 -
 155
155 -
 156
156 -
 157
157 -
 158
158 -
 159
159 -
 160
160 -
 161
161 -
 162
162 -
 163
163 -
 164
164 -
 165
165 -
 166
166 -
 167
167 -
168
-
169
-
170
-
171
-
172
-
173
-
174
-
175
-
176
-
177
-
178
-
179
-
180
-
181
-
182
-
183
-
184
-
185
-
186
-
187
-
188
-
189
-
190
-
191
-
192
-
193
-
194
-
195
-
196
-
197
-
198
-
199
-
200
-
201
-
202
-
203
-
204
-
205
-
206
-
207
-
208
-
209
-
210
-
211
-
212
-
213
-
214
-
215
-
216
-
217
-
218
-
219
-
220
-
221
-
222
-
223
-
224
-
225
-
226
-
227
-
228
-
229
-
230
-
231
-
232
-
233
-
234
-
235
-
236
-
237
-
238
-
239
-
240
-
241
-
242
-
243
-
244
-
245
-
246
-
247
-
248
-
249
-
250
-
251
-
252
-
253
-
254
-
255
-
256
-
257
-
258
-
259
-
260
-
261
-
262
-
263
-
264
-
265
-
266
-
267
-
268
-
269
-
270
-
271
-
272
-
273
-
274
-
275
-
276
-
277
-
278
-
279
-
280
-
281
-
282
-
283
-
284
-
285
-
286
-
287
-
288
 |
 |

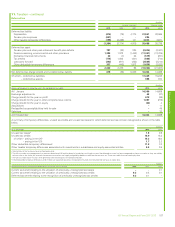
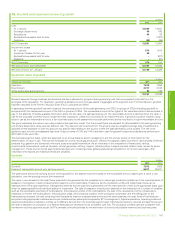
7. Segmental analysis – continued
$ million
2013
By geographical area US Non-US Total
Revenues
Third party sales and other operating revenuesa128,764 250,372 379,136
Other income statement items
Production and similar taxes 1,112 5,935 7,047
Results
Replacement cost profit before interest and taxation 3,114 28,945 32,059
Non-current assets
Other non-current assetsbc 70,228 124,439 194,667
Other investments 1,565
Loans 763
Trade and other receivables 5,985
Derivative financial instruments 3,509
Deferred tax assets 985
Defined benefit pension plan surpluses 1,376
Total non-current assets 208,850
Capital expenditure and acquisitions 9,176 27,436 36,612
aNon-US region includes UK $82,381 million.
bNon-US region includes UK $18,967 million.
cExcluding financial instruments, deferred tax assets and defined benefit pension plan surpluses.
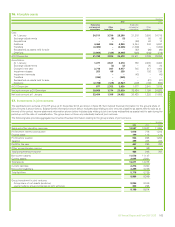
$ million
2012
By geographical area US Non-US Total
Revenues
Third party sales and other operating revenuesa130,940 244,825 375,765
Other income statement items
Production and similar taxes 1,472 6,686 8,158
Results
Replacement cost profit before interest and taxation 180 20,183 20,363
Non-current assets
Other non-current assetsbc 66,751 107,844 174,595
Other investments 2,704
Loans 642
Trade and other receivables 5,961
Derivative financial instruments 4,294
Deferred tax assets 874
Defined benefit pension plan surpluses 12
Total non-current assets 189,082
Capital expenditure and acquisitions 10,541 14,663 25,204
aNon-US region includes UK $75,364 million.
bNon-US region includes UK $17,545 million.
cExcluding financial instruments, deferred tax assets and defined benefit pension plan surpluses.
Financial statements
BP Annual Report and Form 20-F 2013 153