BP 2013 Annual Report Download - page 184
Download and view the complete annual report
Please find page 184 of the 2013 BP annual report below. You can navigate through the pages in the report by either clicking on the pages listed below, or by using the keyword search tool below to find specific information within the annual report.-
 1
1 -
2
-
3
-
4
-
5
-
6
-
7
-
8
-
9
-
10
-
11
-
12
-
13
-
14
-
15
-
16
-
17
-
18
-
19
-
20
-
21
-
22
-
23
-
24
-
25
-
26
-
27
-
28
-
29
-
30
-
31
-
32
-
33
-
34
-
35
-
36
-
37
-
38
-
39
-
40
-
41
-
42
-
43
-
44
-
45
-
46
-
47
-
48
-
49
-
50
-
51
-
52
-
53
-
54
-
55
-
56
-
57
-
58
-
59
-
60
-
61
-
62
-
63
-
64
-
65
-
66
-
67
-
68
-
69
-
70
-
71
-
72
-
73
-
74
-
75
-
76
-
77
-
78
-
79
-
80
-
81
-
82
-
83
-
84
-
85
-
86
-
87
-
88
-
89
-
90
-
91
-
92
-
93
-
94
-
95
-
96
-
97
-
98
-
99
-
100
-
101
-
102
-
103
-
104
-
105
-
106
-
107
-
108
-
109
-
110
-
111
-
112
-
113
-
114
-
115
-
116
-
117
-
118
-
119
-
120
-
121
-
122
-
123
-
124
-
125
-
126
-
127
-
128
-
129
-
130
-
131
-
132
-
133
-
134
-
135
-
136
-
137
-
138
-
139
-
140
-
141
-
142
-
143
-
144
-
145
-
146
-
147
-
148
-
149
-
150
-
151
-
152
-
153
-
154
-
155
-
156
-
157
-
158
-
159
-
160
-
161
-
162
-
163
-
164
-
165
-
166
-
167
-
168
-
169
-
170
-
171
-
172
-
173
-
 174
174 -
 175
175 -
 176
176 -
 177
177 -
 178
178 -
 179
179 -
 180
180 -
 181
181 -
 182
182 -
 183
183 -
 184
184 -
 185
185 -
 186
186 -
 187
187 -
 188
188 -
 189
189 -
 190
190 -
 191
191 -
 192
192 -
 193
193 -
 194
194 -
195
-
196
-
197
-
198
-
199
-
200
-
201
-
202
-
203
-
204
-
205
-
206
-
207
-
208
-
209
-
210
-
211
-
212
-
213
-
214
-
215
-
216
-
217
-
218
-
219
-
220
-
221
-
222
-
223
-
224
-
225
-
226
-
227
-
228
-
229
-
230
-
231
-
232
-
233
-
234
-
235
-
236
-
237
-
238
-
239
-
240
-
241
-
242
-
243
-
244
-
245
-
246
-
247
-
248
-
249
-
250
-
251
-
252
-
253
-
254
-
255
-
256
-
257
-
258
-
259
-
260
-
261
-
262
-
263
-
264
-
265
-
266
-
267
-
268
-
269
-
270
-
271
-
272
-
273
-
274
-
275
-
276
-
277
-
278
-
279
-
280
-
281
-
282
-
283
-
284
-
285
-
286
-
287
-
288
 |
 |

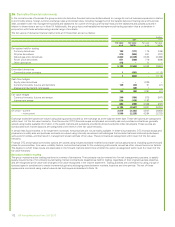
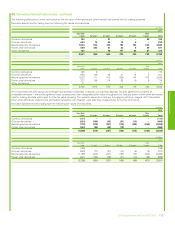
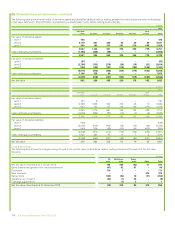
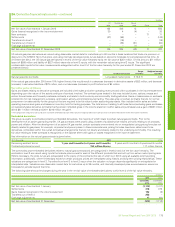
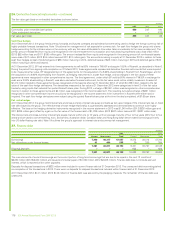
30. Pensions and other post-retirement benefits – continued
Our assumption for future US healthcare cost trend rate for the first year after the reporting date reflects the rate of actual cost increases seen in
recent years. The ultimate trend rate reflects our long-term expectations of the level at which cost inflation will stabilize based on past healthcarecost
inflation seen over a longer period of time. The assumed future US healthcare cost trend rate assumptions are as follows:
%
2013 2012 2011
First year’s US healthcare cost trend rate 7.3 7.3 7.6
Ultimate US healthcare cost trend rate 5.0 5.0 5.0
Year in which ultimate trend rate is reached 2021 2020 2020
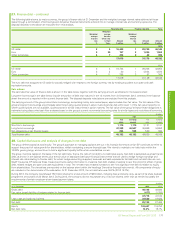
Pension plan assets are generally held in trusts. The primary objective of the trusts is to accumulate pools of assets sufficient to meet the obligations
of the various plans. The assets of the trusts are invested in a manner consistent with fiduciary obligations and principles that reflect current practices
in portfolio management.
A significant proportion of the assets are held in equities, owing to a higher expected level of return over the long term with an acceptable level of risk.
In order to provide reasonable assurance that no single security or type of security has an unwarranted impact on the total portfolio, the investment
portfolios are highly diversified.
The current long-term asset allocation policy for the major plans is as follows:
%
Asset category UK US Other
Total equity 70 60 17-65
Bonds/cash 23 40 25-78
Property/real estate 7 – 0-10
The group’s main pension plans do not invest directly in either securities or property/real estate of the company or of any subsidiary. Some of the
group’s pension plans use derivative financial instruments as part of their asset mix to manage the level of risk.
For the primary UK pension plan there is an agreement with the trustee to reduce the proportion of plan assets held as equities and increase the
proportion held as bonds at certain market trigger points, over time, with a view to better matching the pension liabilities. During 2013 the first trigger
point was reached. There is a similar agreement in place in the US where trigger points were reached in 2011 and 2013.
BP’s main plans in the UK and US do not currently follow a liability driven investment (‘LDI’) approach, a form of investing designed to match the
movement in pension plan assets with the movement in projected benefit obligations over time.
180 BP Annual Report and Form 20-F 2013