AT&T Wireless 2012 Annual Report Download - page 86
Download and view the complete annual report
Please find page 86 of the 2012 AT&T Wireless annual report below. You can navigate through the pages in the report by either clicking on the pages listed below, or by using the keyword search tool below to find specific information within the annual report.-
 1
1 -
2
-
3
-
4
-
5
-
6
-
7
-
8
-
9
-
10
-
11
-
12
-
13
-
14
-
15
-
16
-
17
-
18
-
19
-
20
-
21
-
22
-
23
-
24
-
25
-
26
-
27
-
28
-
29
-
30
-
31
-
32
-
33
-
34
-
35
-
36
-
37
-
38
-
39
-
40
-
41
-
42
-
43
-
44
-
45
-
46
-
47
-
48
-
49
-
50
-
51
-
52
-
53
-
54
-
55
-
56
-
57
-
58
-
59
-
60
-
61
-
62
-
63
-
64
-
65
-
66
-
67
-
68
-
69
-
70
-
71
-
72
-
73
-
74
-
75
-
 76
76 -
 77
77 -
 78
78 -
 79
79 -
 80
80 -
 81
81 -
 82
82 -
 83
83 -
 84
84 -
 85
85 -
 86
86 -
 87
87 -
 88
88 -
 89
89 -
 90
90 -
 91
91 -
 92
92 -
 93
93 -
 94
94 -
 95
95 -
 96
96 -
97
-
98
-
99
-
100
 |
 |

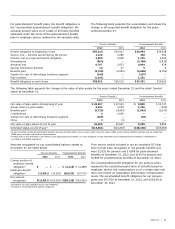
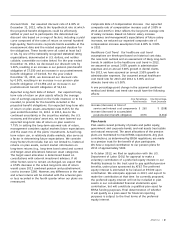
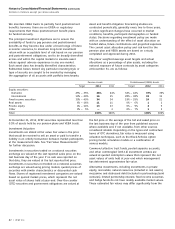
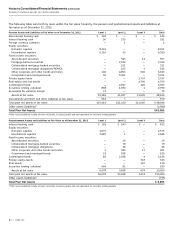
Notes to Consolidated Financial Statements (continued)
Dollars in millions except per share amounts
84 | AT&T Inc.
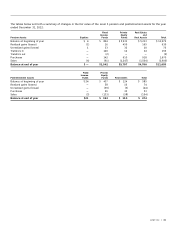
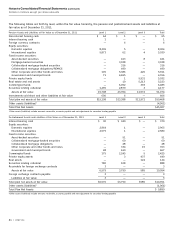
The following table sets forth by level, within the fair value hierarchy, the pension and postretirement assets and liabilities at
fair value as of December 31, 2012:
Pension Assets and Liabilities at Fair Value as of December 31, 2012 Level 1 Level 2 Level 3 Total
Non-interest bearing cash $ 144 $ — $ — $ 144
Interest bearing cash 56 235 — 291
Foreign currency contracts — 1 — 1
Equity securities:
Domestic equities 8,291 — — 8,291
International equities 6,361 29 — 6,390
Fixed income securities:
Asset-backed securities — 543 14 557
Mortgage-backed securities — 2,324 — 2,324
Collateralized mortgage-backed securities — 311 — 311
Collateralized mortgage obligations/REMICS — 523 1 524
Other Corporate and other bonds and notes 140 4,903 600 5,643
Government and municipal bonds 50 5,301 — 5,351
Private equity funds — — 5,797 5,797
Real estate and real assets — — 4,766 4,766
Commingled funds — 4,927 426 5,353
Securities lending collateral 868 1,930 1 2,799
Receivable for variation margin 72 — — 72
Assets at fair value 15,982 21,027 11,605 48,614
Investments sold short and other liabilities at fair value 563 7 — 570
Total plan net assets at fair value $15,419 $21,020 $11,605 $ 48,044
Other assets (liabilities)1 (2,984)
Total Plan Net Assets $45,060
1Other assets (liabilities) include amounts receivable, accounts payable and net adjustment for securities lending payable.
Postretirement Assets and Liabilities at Fair Value as of December 31, 2012 Level 1 Level 2 Level 3 Total
Interest bearing cash $ 169 $ 243 $ — $ 412
Equity securities:
Domestic equities 2,575 — — 2,575
International equities 2,685 1 — 2,686
Fixed income securities:
Asset-backed securities — 29 — 29
Collateralized mortgage-backed securities — 79 — 79
Collateralized mortgage obligations — 46 — 46
Other Corporate and other bonds and notes 1 383 17 401
Government and municipal bonds 22 598 — 620
Commingled funds 82 2,038 4 2,124
Private equity assets — — 343 343
Real assets — — 110 110
Securities lending collateral 544 81 — 625
Assets at fair value 6,078 3,498 474 10,050
Total plan net assets at fair value $6,078 $3,498 $474 $10,050
Other assets (liabilities)1 (755)
Total Plan Net Assets $ 9,295
1Other assets (liabilities) include amounts receivable, accounts payable and net adjustment for securities lending payable.