AT&T Wireless 2012 Annual Report Download - page 40
Download and view the complete annual report
Please find page 40 of the 2012 AT&T Wireless annual report below. You can navigate through the pages in the report by either clicking on the pages listed below, or by using the keyword search tool below to find specific information within the annual report.-
 1
1 -
2
-
3
-
4
-
5
-
6
-
7
-
8
-
9
-
10
-
11
-
12
-
13
-
14
-
15
-
16
-
17
-
18
-
19
-
20
-
21
-
22
-
23
-
24
-
25
-
26
-
27
-
28
-
29
-
 30
30 -
 31
31 -
 32
32 -
 33
33 -
 34
34 -
 35
35 -
 36
36 -
 37
37 -
 38
38 -
 39
39 -
 40
40 -
 41
41 -
 42
42 -
 43
43 -
 44
44 -
 45
45 -
 46
46 -
 47
47 -
 48
48 -
 49
49 -
 50
50 -
51
-
52
-
53
-
54
-
55
-
56
-
57
-
58
-
59
-
60
-
61
-
62
-
63
-
64
-
65
-
66
-
67
-
68
-
69
-
70
-
71
-
72
-
73
-
74
-
75
-
76
-
77
-
78
-
79
-
80
-
81
-
82
-
83
-
84
-
85
-
86
-
87
-
88
-
89
-
90
-
91
-
92
-
93
-
94
-
95
-
96
-
97
-
98
-
99
-
100
 |
 |

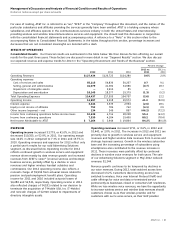
Management’s Discussion and Analysis of Financial Condition and Results of Operations (continued)
Dollars in millions except per share amounts
38 | AT&T Inc.
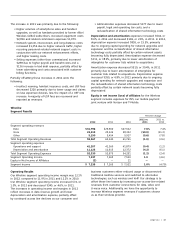
Data revenues increased $2,238, or 7.6%, in 2012 and
$2,048, or 7.4%, in 2011. Data revenues accounted for
approximately 53% of wireline operating revenues in 2012,
49% in 2011 and 45% in 2010. Data revenues include IP,
strategic business and traditional data services.
• IP data revenues (excluding strategic business services
below) increased $2,023, or 15.0%, in 2012 and $1,863,
or 16.0%, in 2011 primarily driven by higher U-verse
penetration. In 2012 and 2011, U-verse video revenues
increased $1,057 and $1,206, broadband high-speed
Internet access revenue increased $605 and $365 and
U-verse voice revenue increased $251 and $286,
respectively. The increases in IP data revenues reflect
continued growth in the customer base and migration
from other traditional circuit-based services. New and
existing U-verse customers are shifting from traditional
landlines to our U-verse Voice and from DSL to
our U-verse High Speed Internet access offerings.
At December 31, 2012, more residential customers
subscribed to our U-verse High Speed Internet services
than our traditional DSL offering.
• Strategic business services, which include Ethernet,
Virtual Private Networks (VPN), Hosting, IP Conferencing
and application services, increased $753, or 13.5%, in
2012 and $854, or 18.1%, in 2011. These increases were
driven by increased VPN revenues, which contributed
additional revenues of $431 and $563 and Ethernet
revenues, which increased by $286 and $218 in 2012
and 2011.
• Traditional data revenues, which include transport
(excluding Ethernet) and packet-switched data services,
decreased $538, or 5.1%, in 2012 and $669, or 6.0%,
in 2011. These decreases were primarily due to lower
demand as customers continue to shift to IP-based
technology such as VPN, U-verse High Speed Internet
access and managed Internet services. We expect
these traditional services to continue to decline as a
percentage of our overall data revenues.
Voice revenues decreased $2,507, or 10.0%, in 2012 and
$3,206, or 11.3%, in 2011 primarily due to declining demand
for traditional voice services by our consumer and business
customers. Included in voice revenues are revenues from
local voice, long distance (including international) and local
wholesale services. Voice revenues do not include VoIP
revenues, which are included in data revenues.
• Local voice revenues decreased $1,526, or 9.9%, in 2012
and $2,067, or 11.8%, in 2011. The decrease in 2012
and 2011 was driven primarily by a 13.2% and 12.3%
decline in switched access lines. We expect our local
voice revenue to continue to be negatively affected by
competition from alternative technologies and continued
declines in switched access lines.
• Long-distance revenues decreased $965, or 11.2%, in
2012 and $1,066, or 11.0%, in 2011. Lower demand
for long-distance service from global businesses and
consumer customers decreased revenues $799 in 2012
and $822 in 2011. Additionally, expected declines in the
number of national mass-market customers decreased
revenues $165 in 2012 and $235 in 2011.
Other operating revenues decreased $304, or 5.6%, in 2012
and $463, or 7.8%, in 2011. Major items included in other
operating revenues are integration services and customer
premises equipment, government-related services and
outsourcing, which account for approximately 60% of total
other revenue in the years reported.
Operations and support expenses decreased $153, or 0.4%,
in 2012 and $519, or 1.2%, in 2011. Operations and support
expenses consist of costs incurred to provide our products
and services, including costs of operating and maintaining
our networks and personnel costs, such as compensation
and benefits.
The 2012 decrease was primarily due to lower employee-
related expense of $470, reflecting ongoing workforce
reduction initiatives, decreased traffic compensation expense
of $281 and lower nonemployee-related expense of $172.
These decreases were partially offset by increased cost of
sales, primarily related to U-verse related expenses of $538
and increased USF fees of $254.
The 2011 decrease was primarily due to lower traffic
compensation expense of $423, decreased employee-related
expense of $401, reflecting ongoing workforce reduction
initiatives, lower bad debt expense of $216 due to lower
revenue from business customers and improvements in cash
collections, and decreased USF fees of $71. These decreases
were partially offset by increased cost of sales, primarily
related to U-verse related expenses of $451 and increased
contract services of $217.
Depreciation and amortization expenses decreased $492,
or 4.2%, in 2012 and $757, or 6.1%, in 2011. Both decreases
were primarily related to lower amortization of intangibles
for customer lists associated with acquisitions.