AT&T Wireless 2012 Annual Report Download - page 32
Download and view the complete annual report
Please find page 32 of the 2012 AT&T Wireless annual report below. You can navigate through the pages in the report by either clicking on the pages listed below, or by using the keyword search tool below to find specific information within the annual report.-
 1
1 -
2
-
3
-
4
-
5
-
6
-
7
-
8
-
9
-
10
-
11
-
12
-
13
-
14
-
15
-
16
-
17
-
18
-
19
-
20
-
21
-
 22
22 -
 23
23 -
 24
24 -
 25
25 -
 26
26 -
 27
27 -
 28
28 -
 29
29 -
 30
30 -
 31
31 -
 32
32 -
 33
33 -
 34
34 -
 35
35 -
 36
36 -
 37
37 -
 38
38 -
 39
39 -
 40
40 -
 41
41 -
 42
42 -
43
-
44
-
45
-
46
-
47
-
48
-
49
-
50
-
51
-
52
-
53
-
54
-
55
-
56
-
57
-
58
-
59
-
60
-
61
-
62
-
63
-
64
-
65
-
66
-
67
-
68
-
69
-
70
-
71
-
72
-
73
-
74
-
75
-
76
-
77
-
78
-
79
-
80
-
81
-
82
-
83
-
84
-
85
-
86
-
87
-
88
-
89
-
90
-
91
-
92
-
93
-
94
-
95
-
96
-
97
-
98
-
99
-
100
 |
 |

30 | AT&T Inc.
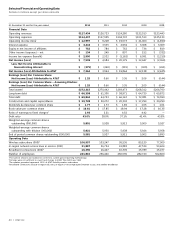
Selected Financial and Operating Data
Dollars in millions except per share amounts
At December 31 and for the year ended: 2012 2011 2010 2009 2008
Financial Data
Operating revenues $127,434 $126,723 $124,280 $122,513 $123,443
Operating expenses $114,437 $117,505 $104,707 $101,513 $125,133
Operating income (loss) $ 12,997 $ 9,218 $ 19,573 $ 21,000 $ (1,690)
Interest expense $ 3,444 $ 3,535 $ 2,994 $ 3,368 $ 3,369
Equity in net income of affiliates $ 752 $ 784 $ 762 $ 734 $ 819
Other income (expense) – net $ 134 $ 249 $ 897 $ 152 $ (332)
Income tax expense (benefit) $ 2,900 $ 2,532 $ (1,162) $ 6,091 $ (2,210)
Net Income (Loss) $ 7,539 $ 4,184 $ 20,179 $ 12,447 $ (2,364)
Less: Net Income Attributable to
Noncontrolling Interest $ (275) $ (240) $ (315) $ (309) $ (261)
Net Income (Loss) Attributable to AT&T $ 7,264 $ 3,944 $ 19,864 $ 12,138 $ (2,625)
Earnings (Loss) Per Common Share:
Net Income (Loss) Attributable to AT&T $ 1.25 $ 0.66 $ 3.36 $ 2.06 $ (0.44)
Earnings (Loss) Per Common Share – Assuming Dilution:
Net Income (Loss) Attributable to AT&T $ 1.25 $ 0.66 $ 3.35 $ 2.05 $ (0.44)
Total assets1 $272,315 $270,442 $269,473 $268,312 $264,700
Long-term debt $ 66,358 $ 61,300 $ 58,971 $ 64,720 $ 60,872
Total debt $ 69,844 $ 64,753 $ 66,167 $ 72,081 $ 74,990
Construction and capital expenditures $ 19,728 $ 20,272 $ 20,302 $ 17,294 $ 20,290
Dividends declared per common share $ 1.77 $ 1.73 $ 1.69 $ 1.65 $ 1.61
Book value per common share $ 16.61 $ 17.85 $ 18.94 $ 17.28 $ 16.35
Ratio of earnings to fixed charges2 2.93 2.21 4.52 4.42 —
Debt ratio 43.0% 38.0% 37.1% 41.4% 43.8%
Weighted-average common shares
outstanding (000,000) 5,801 5,928 5,913 5,900 5,927
Weighted-average common shares
outstanding with dilution (000,000) 5,821 5,950 5,938 5,924 5,958
End of period common shares outstanding (000,000) 5,581 5,927 5,911 5,902 5,893
Operating Data
Wireless subscribers (000)3 106,957 103,247 95,536 85,120 77,009
In-region network access lines in service (000) 31,887 36,734 41,883 47,534 53,604
Broadband connections (000)4 16,390 16,427 16,309 15,789 15,077
Number of employees 241,810 256,420 266,590 282,720 302,660
1Prior-period amounts are restated to conform to current-period reporting methodology.
2Earnings were not sufficient to cover fixed charges in 2008. The deficit was $943.
3The number presented represents 100% of AT&T Mobility wireless subscribers.
4Broadband connections include in-region DSL lines, in-region U-verse High Speed Internet access, and satellite broadband.