AT&T Wireless 2012 Annual Report Download - page 41
Download and view the complete annual report
Please find page 41 of the 2012 AT&T Wireless annual report below. You can navigate through the pages in the report by either clicking on the pages listed below, or by using the keyword search tool below to find specific information within the annual report.-
 1
1 -
2
-
3
-
4
-
5
-
6
-
7
-
8
-
9
-
10
-
11
-
12
-
13
-
14
-
15
-
16
-
17
-
18
-
19
-
20
-
21
-
22
-
23
-
24
-
25
-
26
-
27
-
28
-
29
-
30
-
 31
31 -
 32
32 -
 33
33 -
 34
34 -
 35
35 -
 36
36 -
 37
37 -
 38
38 -
 39
39 -
 40
40 -
 41
41 -
 42
42 -
 43
43 -
 44
44 -
 45
45 -
 46
46 -
 47
47 -
 48
48 -
 49
49 -
 50
50 -
 51
51 -
52
-
53
-
54
-
55
-
56
-
57
-
58
-
59
-
60
-
61
-
62
-
63
-
64
-
65
-
66
-
67
-
68
-
69
-
70
-
71
-
72
-
73
-
74
-
75
-
76
-
77
-
78
-
79
-
80
-
81
-
82
-
83
-
84
-
85
-
86
-
87
-
88
-
89
-
90
-
91
-
92
-
93
-
94
-
95
-
96
-
97
-
98
-
99
-
100
 |
 |

AT&T Inc. | 39
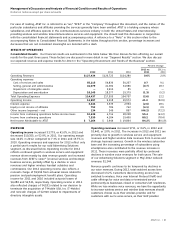
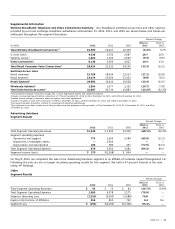
Supplemental Information
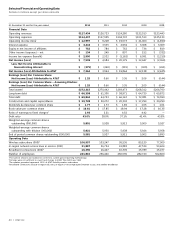
Wireline Broadband, Telephone and Video Connections Summary Our broadband, switched access lines and other services
provided by our local exchange telephone subsidiaries at December 31, 2012, 2011, and 2010 are shown below and trends are
addressed throughout this segment discussion.
Percent Change
2012 vs. 2011 vs.
(in 000s) 2012 2011 2010 2011 2010
Total Wireline Broadband Connections1,2 16,390 16,427 16,309 (0.2)% 0.7%
U-verse video 4,536 3,791 2,987 19.7 26.9
Satellite service3 1,600 1,765 1,930 (9.3) (8.5)
Video Connections 6,136 5,556 4,917 10.4 13.0
Total Retail Consumer Voice Connections4 18,614 21,232 24,195 (12.3) (12.2)
Switched Access Lines
Retail consumer 15,709 18,954 22,515 (17.1) (15.8)
Retail business5 14,274 15,656 17,053 (8.8) (8.2)
Retail Subtotal5 29,983 34,610 39,568 (13.4) (12.5)
Wholesale Subtotal5 1,854 2,077 2,252 (10.7) (7.8)
Total Switched Access Lines6 31,887 36,734 41,883 (13.2)% (12.3)%
1
Total wireline broadband connections include DSL, U-verse High Speed Internet and satellite broadband.
2
Includes U-verse High Speed Internet connections of 7,716 at December 31, 2012, 5,223 at December 31, 2011, and 3,278 at December 31, 2010.
3
Satellite service includes connections under our agency and resale agreements.
4
Includes consumer U-verse VoIP connections of 2,905 at December 31, 2012, 2,278 at December 31, 2011, and 1,680 at December 31, 2010.
5Prior-period amounts restated to conform to current-period reporting methodology.
6
Total switched access lines include access lines provided to private payphone service providers of 50 at December 31, 2012, 47 at December 31, 2011, and 63 at
December 31, 2010.
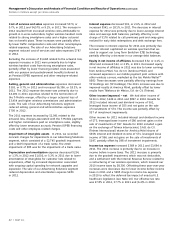
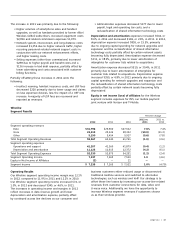
Advertising Solutions
Segment Results
Percent Change
2012 vs. 2011 vs.
2012 2011 2010 2011 2010
Total Segment Operating Revenues $1,049 $ 3,293 $3,935 (68.1)% (16.3)%
Segment operating expenses
Operations and support 773 2,265 2,584 (65.9) (12.3)
Impairment of intangible assets — 2,910 — — —
Depreciation and amortization 106 386 497 (72.5) (22.3)
Total Segment Operating Expenses 879 5,561 3,081 (84.2) 80.5
Segment Income (Loss) $ 170 $(2,268) $ 854 — —
On May 8, 2012, we completed the sale of our Advertising Solutions segment to an affiliate of Cerberus Capital Management, L.P.
Following the sale, we are no longer recording operating results for this segment. We hold a 47 percent interest in the new
entity, YP Holdings.
Other
Segment Results
Percent Change
2012 vs. 2011 vs.
2012 2011 2010 2011 2010
Total Segment Operating Revenues $ 55 $ 75 $ 83 (26.7)% (9.6)%
Total Segment Operating Expenses 1,065 5,078 2,171 (79.0) —
Segment Operating Loss (1,010) (5,003) (2,088) 79.8 —
Equity in Net Income of Affiliates 816 813 742 0.4 9.6
Segment Loss $ (194) $(4,190) $(1,346) 95.4% —