AT&T Wireless 2012 Annual Report Download - page 82
Download and view the complete annual report
Please find page 82 of the 2012 AT&T Wireless annual report below. You can navigate through the pages in the report by either clicking on the pages listed below, or by using the keyword search tool below to find specific information within the annual report.-
 1
1 -
2
-
3
-
4
-
5
-
6
-
7
-
8
-
9
-
10
-
11
-
12
-
13
-
14
-
15
-
16
-
17
-
18
-
19
-
20
-
21
-
22
-
23
-
24
-
25
-
26
-
27
-
28
-
29
-
30
-
31
-
32
-
33
-
34
-
35
-
36
-
37
-
38
-
39
-
40
-
41
-
42
-
43
-
44
-
45
-
46
-
47
-
48
-
49
-
50
-
51
-
52
-
53
-
54
-
55
-
56
-
57
-
58
-
59
-
60
-
61
-
62
-
63
-
64
-
65
-
66
-
67
-
68
-
69
-
70
-
71
-
 72
72 -
 73
73 -
 74
74 -
 75
75 -
 76
76 -
 77
77 -
 78
78 -
 79
79 -
 80
80 -
 81
81 -
 82
82 -
 83
83 -
 84
84 -
 85
85 -
 86
86 -
 87
87 -
 88
88 -
 89
89 -
 90
90 -
 91
91 -
 92
92 -
93
-
94
-
95
-
96
-
97
-
98
-
99
-
100
 |
 |

Notes to Consolidated Financial Statements (continued)
Dollars in millions except per share amounts
80 | AT&T Inc.
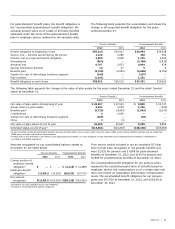
and capital expenditures, providing a small reduction in the net
expense recorded.
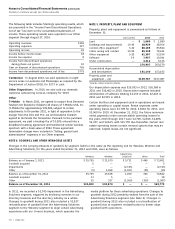
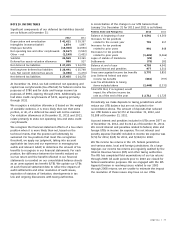
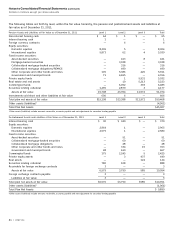
The following tables present the components of net periodic
benefit obligation cost and other changes in plan assets and
benefit obligations recognized in OCI:
Net Periodic Benefit Cost and Other Amounts
Recognized in Other Comprehensive Income
Our combined net pension and postretirement cost recognized
in our consolidated statements of income was $10,257, $7,288
and $3,750 for the years ended December 31, 2012, 2011 and
2010. A portion of pension and postretirement benefit costs is
capitalized as part of the benefit load on internal construction
Net Periodic Benefit Cost
Pension Benefits Postretirement Benefits
2012 2011 2010 2012 2011 2010
Service cost – benefits earned during the period $ 1,216 $ 1,186 $ 1,075 $ 336 $ 362 $ 348
Interest cost on projected benefit obligation 2,800 2,958 3,150 1,725 2,051 2,257
Expected return on assets (3,520) (3,690) (3,775) (811) (1,040) (943)
Amortization of prior service cost (credit) (15) (15) (16) (927) (694) (624)
Actuarial (gain) loss 5,206 4,498 1,768 4,247 1,672 510
Net pension and postretirement cost1 $ 5,687 $ 4,937 $ 2,202 $4,570 $ 2,351 $1,548
1 During 2012, 2011 and 2010, the Medicare Prescription Drug, Improvement, and Modernization Act of 2003 reduced postretirement benefit cost by $142, $280 and $237.
This effect is included in several line items above.
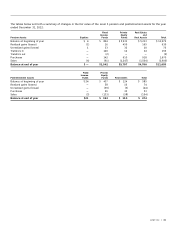
Other Changes in Plan Assets and Benefit Obligations Recognized in Other Comprehensive Income
Pension Benefits Postretirement Benefits
2012 2011 2010 2012 2011 2010
Prior service (cost) credit $559 $ — $ — $1,686 $1,134 $ 459
Amortization of prior service cost (credit) (10) (10) (10) (575) (430) (388)
Total recognized in other comprehensive (income) loss (net of tax) $549 $(10) $(10) $1,111 $ 704 $ 71
Uncertainty in the securities markets and U.S. economy
could result in investment returns less than those assumed.
Should the securities markets decline or medical and
prescription drug costs increase at a rate greater than
assumed, we would expect increasing annual combined net
pension and postretirement costs for the next several years.
Should actual experience differ from actuarial assumptions,
the projected pension benefit obligation and net pension
cost and accumulated postretirement benefit obligation
and postretirement benefit cost would be affected in
future years.
Our expected return on plan assets is calculated using the
actual fair value of plan assets. We recognize actual gains
and losses on pension and postretirement plan assets
immediately in our operating results. These gains and losses
are measured annually as of December 31 and accordingly
will be recorded during the fourth quarter, unless earlier
remeasurements are required.
The estimated prior service credits that will be amortized from
accumulated OCI into net periodic benefit cost over the next
fiscal year is $94 for pension and $1,049 for postretirement
benefits.
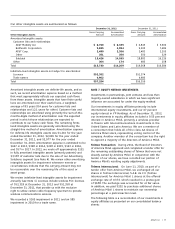
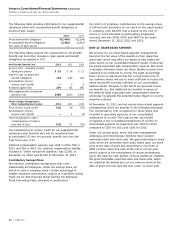
Assumptions
In determining the projected benefit obligation and the net
pension and postemployment benefit cost, we used the
following significant weighted-average assumptions:
2012 2011 2010
Discount rate for determining
projected benefit obligation
at December 31 4.30% 5.30% 5.80%
Discount rate in effect for
determining net cost 5.30% 5.80% 6.50%
Long-term rate of return
on plan assets 8.25% 8.25% 8.50%
Composite rate of compensation
increase for determining
projected benefit obligation 3.00% 4.00% 4.00%
Composite rate of compensation
increase for determining
net pension cost (benefit) 4.00% 4.00% 4.00%