AT&T Wireless 2012 Annual Report Download - page 56
Download and view the complete annual report
Please find page 56 of the 2012 AT&T Wireless annual report below. You can navigate through the pages in the report by either clicking on the pages listed below, or by using the keyword search tool below to find specific information within the annual report.-
 1
1 -
2
-
3
-
4
-
5
-
6
-
7
-
8
-
9
-
10
-
11
-
12
-
13
-
14
-
15
-
16
-
17
-
18
-
19
-
20
-
21
-
22
-
23
-
24
-
25
-
26
-
27
-
28
-
29
-
30
-
31
-
32
-
33
-
34
-
35
-
36
-
37
-
38
-
39
-
40
-
41
-
42
-
43
-
44
-
45
-
 46
46 -
 47
47 -
 48
48 -
 49
49 -
 50
50 -
 51
51 -
 52
52 -
 53
53 -
 54
54 -
 55
55 -
 56
56 -
 57
57 -
 58
58 -
 59
59 -
 60
60 -
 61
61 -
 62
62 -
 63
63 -
 64
64 -
 65
65 -
 66
66 -
67
-
68
-
69
-
70
-
71
-
72
-
73
-
74
-
75
-
76
-
77
-
78
-
79
-
80
-
81
-
82
-
83
-
84
-
85
-
86
-
87
-
88
-
89
-
90
-
91
-
92
-
93
-
94
-
95
-
96
-
97
-
98
-
99
-
100
 |
 |

Management’s Discussion and Analysis of Financial Condition and Results of Operations (continued)
Dollars in millions except per share amounts
54 | AT&T Inc.
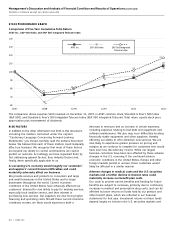
STOCK PERFORMANCE GRAPH
Comparison of Five Year Cumulative Total Return
AT&T Inc., S&P 500 Index, and S&P 500 Integrated Telecom Index
140
130
120
110
100
90
80
70
60
12/07 12/08 12/09 12/10 12/11 12/12
63
S&P 500 Integrated
Telecom Index
AT&T Inc. S&P 500 Index
80 84
108
75
75
92 92
102
117
72
94
109
95
80
The comparison above assumes $100 invested on December 31, 2007, in AT&T common stock, Standard & Poor’s 500 Index
(S&P 500), and Standard & Poor’s 500 Integrated Telecom Index (S&P 500 Integrated Telecom). Total return equals stock price
appreciation plus reinvestment of dividends.
RISK FACTORS
In addition to the other information set forth in this document,
including the matters contained under the caption
“Cautionary Language Concerning Forward-Looking
Statements,” you should carefully read the matters described
below. We believe that each of these matters could materially
affect our business. We recognize that most of these factors
are beyond our ability to control and therefore we cannot
predict an outcome. Accordingly, we have organized them by
first addressing general factors, then industry factors and,
finally, items specifically applicable to us.
A worsening U.S. economy would magnify our customers’
and suppliers’ current financial difficulties and could
materially adversely affect our business.
We provide services and products to consumers and large
and small businesses in the United States and to larger
businesses throughout the world. Current economic
conditions in the United States have adversely affected our
customers’ demand for and ability to pay for existing services,
especially local landline service, and their interest in
purchasing new services. Our suppliers are also facing higher
financing and operating costs. Should these current economic
conditions worsen, we likely would experience both a
decrease in revenues and an increase in certain expenses,
including expenses relating to bad debt and equipment and
software maintenance. We also may incur difficulties locating
financially stable equipment and other suppliers, thereby
affecting our ability to offer attractive new services. We are
also likely to experience greater pressure on pricing and
margins as we continue to compete for customers who would
have even less discretionary income. While our largest
business customers have been less affected by these adverse
changes in the U.S. economy, if the continued adverse
economic conditions in the United States, Europe and other
foreign markets persist or worsen, those customers would
likely be affected in a similar manner.
Adverse changes in medical costs and the U.S. securities
markets and a further decline in interest rates could
materially increase our benefit plan costs.
Our costs to provide current benefits and funding for future
benefits are subject to increases, primarily due to continuing
increases in medical and prescription drug costs, and can be
affected by lower returns on funds held by our pension and
other benefit plans, which are reflected in our financial
statements for that year. Investment returns on these funds
depend largely on trends in the U.S. securities markets and