AT&T Wireless 2012 Annual Report Download - page 38
Download and view the complete annual report
Please find page 38 of the 2012 AT&T Wireless annual report below. You can navigate through the pages in the report by either clicking on the pages listed below, or by using the keyword search tool below to find specific information within the annual report.-
 1
1 -
2
-
3
-
4
-
5
-
6
-
7
-
8
-
9
-
10
-
11
-
12
-
13
-
14
-
15
-
16
-
17
-
18
-
19
-
20
-
21
-
22
-
23
-
24
-
25
-
26
-
27
-
 28
28 -
 29
29 -
 30
30 -
 31
31 -
 32
32 -
 33
33 -
 34
34 -
 35
35 -
 36
36 -
 37
37 -
 38
38 -
 39
39 -
 40
40 -
 41
41 -
 42
42 -
 43
43 -
 44
44 -
 45
45 -
 46
46 -
 47
47 -
 48
48 -
49
-
50
-
51
-
52
-
53
-
54
-
55
-
56
-
57
-
58
-
59
-
60
-
61
-
62
-
63
-
64
-
65
-
66
-
67
-
68
-
69
-
70
-
71
-
72
-
73
-
74
-
75
-
76
-
77
-
78
-
79
-
80
-
81
-
82
-
83
-
84
-
85
-
86
-
87
-
88
-
89
-
90
-
91
-
92
-
93
-
94
-
95
-
96
-
97
-
98
-
99
-
100
 |
 |

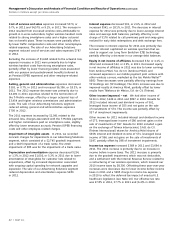
Management’s Discussion and Analysis of Financial Condition and Results of Operations (continued)
Dollars in millions except per share amounts
36 | AT&T Inc.
• Voice and other service revenues decreased $1,466, or
4.2%, in 2012 and $608, or 1.7%, in 2011. While the
number of wireless subscribers increased 3.6% in 2012,
and 8.1% in 2011, these revenues continued to decline
due to voice access and usage declines, as noted in the
ARPU and subscriber relationships discussions above.
Equipment revenues increased $1,088, or 16.8%, in 2012 and
$1,498, or 30.0%, in 2011. The increase in 2012 was primarily
due to a year-over-year increase in smartphone sales as a
percentage of total device sales to postpaid subscribers,
partially offset by lower device upgrades. During the first
quarter of 2012, we introduced an increase in the handset
upgrade fee, which also contributed to the year-over-year
increase in equipment revenues in 2012. The increase in
2011 was primarily due to the launch of a new iPhone
model, which resulted in even higher iPhone sales and
upgrades compared to the 2010 launch.
Operations and support expenses increased $2,014, or 4.9%,
in 2012 and $5,097, or 14.1%, in 2011. The increase in 2012
was primarily due to the following:
• Commission expenses increased $636 due to a year-
over-year increase in smartphone sales as a percentage
of total device sales, partially offset by the overall
decline in handset upgrade activity and total device
sales.
• Selling expenses (other than commissions) and
administrative expenses increased $532 due primarily
to a $181 increase in information technology costs in
conjunction with ongoing support systems development,
$137 increase in employee-related costs, $99 increase
in nonemployee-related costs, and $89 increase in bad
debt expense, partially offset by a $57 decline in
advertising costs.
• Equipment costs increased $501, reflecting sales of the
more expensive smartphones, partially offset by the
overall decline in upgrade activity and total device sales.
• Network system, interconnect, and long-distance costs
increased $202 primarily due to higher network traffic,
personnel-related network support costs and cell site
related costs in conjunction with our network
enhancement efforts and storm costs.
• Universal Service Fund (USF) fees increased $166
primarily due to USF rate increases. A majority of
USF fees are recovered and reported as revenues.
• Handset insurance cost increased $141 due to claims
on more expensive devices.
Partially offsetting these increases, incollect roaming fees
decreased $115 primarily due to rate declines and lower
roaming use associated with the integration of previously
acquired subscribers into our network.
subscribers is typically lower compared to that generated
from our smartphone subscribers on postpaid and other
plans. Data services ARPU increased 11.1% in 2012 and 9.8%
in 2011, reflecting increased smartphone and data-centric
device use. We expect continued revenue growth from
data services as more subscribers use smartphones and
data-centric devices, and as we continue to expand our
network. Voice and other service ARPU declined 9.7% in
2012 and 10.9% in 2011 due to voice access and usage
trends and a shift toward a greater percentage of data-
centric devices. We expect continued pressure on voice
and other service ARPU.
Churn The effective management of subscriber churn is
critical to our ability to maximize revenue growth and to
maintain and improve margins. The total and postpaid churn
rates were down slightly in 2012, reflecting popularity of
our discount plans. Total and postpaid churn increased in
2011, reflecting integration efforts from a prior merger and
higher connected device churn rates. Reseller subscribers
have traditionally had the lowest churn rate among our
wireless subscribers; however, in 2012, the disconnection
of zero-revenue customers has caused our total churn
rate to increase.
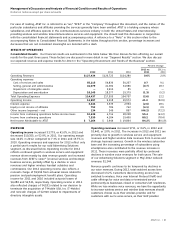
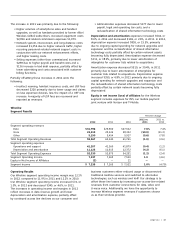
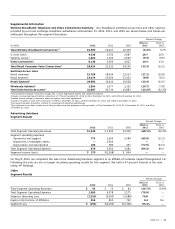
Operating Results
Segment operating income margin was 24.9% in 2012,
compared to 24.7% in 2011 and 27.0% in 2010. Our Wireless
segment operating income increased $990, or 6.3%, in 2012
and decreased $214, or 1.4%, in 2011. The operating income
and margin increase in 2012 reflected continuing data
revenue growth and operating efficiencies, partially offset by
the high subsidies associated with growing smartphone sales.
The margin decrease in 2011 reflected higher equipment and
selling costs associated with higher smartphone sales and
handset upgrades, partially offset by higher data revenues
generated by our postpaid subscribers. While we subsidize
the sales prices of various smartphones, we expect to recover
that cost over time from increased usage of the devices,
especially data usage by the subscriber.
Service revenues are comprised of local voice and data
services, roaming, long distance and other revenue. Service
revenues increased $2,460, or 4.3%, in 2012 and $3,216,
or 6.0%, in 2011. The increases consisted of the following:
• Data service revenues increased $3,926, or 17.8%, in
2012 and $3,824, or 21.0%, in 2011. The increases were
primarily due to the increased number of subscribers
using smartphones and data-centric devices, such as
eReaders, tablets, and mobile navigation devices.
Data service revenues accounted for approximately
43.8% of our wireless service revenues in 2012,
compared to 38.8% in 2011 and 34.0% in 2010.