AT&T Wireless 2012 Annual Report Download - page 39
Download and view the complete annual report
Please find page 39 of the 2012 AT&T Wireless annual report below. You can navigate through the pages in the report by either clicking on the pages listed below, or by using the keyword search tool below to find specific information within the annual report.-
 1
1 -
2
-
3
-
4
-
5
-
6
-
7
-
8
-
9
-
10
-
11
-
12
-
13
-
14
-
15
-
16
-
17
-
18
-
19
-
20
-
21
-
22
-
23
-
24
-
25
-
26
-
27
-
28
-
 29
29 -
 30
30 -
 31
31 -
 32
32 -
 33
33 -
 34
34 -
 35
35 -
 36
36 -
 37
37 -
 38
38 -
 39
39 -
 40
40 -
 41
41 -
 42
42 -
 43
43 -
 44
44 -
 45
45 -
 46
46 -
 47
47 -
 48
48 -
 49
49 -
50
-
51
-
52
-
53
-
54
-
55
-
56
-
57
-
58
-
59
-
60
-
61
-
62
-
63
-
64
-
65
-
66
-
67
-
68
-
69
-
70
-
71
-
72
-
73
-
74
-
75
-
76
-
77
-
78
-
79
-
80
-
81
-
82
-
83
-
84
-
85
-
86
-
87
-
88
-
89
-
90
-
91
-
92
-
93
-
94
-
95
-
96
-
97
-
98
-
99
-
100
 |
 |

AT&T Inc. | 37
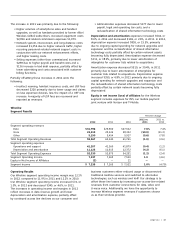
• Administrative expenses decreased $177 due to lower
payroll, legal and operating tax costs, and a
reclassification of shared information technology costs.
Depreciation and amortization expenses increased $544, or
8.6%, in 2012 and decreased $169, or 2.6%, in 2011. In 2012,
depreciation expense increased $855, or 15.5%, primarily
due to ongoing capital spending for network upgrades and
expansion and the reclassification of shared information
technology costs partially offset by certain network assets
becoming fully depreciated. Amortization expense decreased
$311, or 38.9%, primarily due to lower amortization of
intangibles for customer lists related to acquisitions.
Amortization expense decreased $519, or 39.4%, in 2011
primarily due to lower amortization of intangibles for
customer lists related to acquisitions. Depreciation expense
increased $350, or 6.8%, in 2011 primarily due to ongoing
capital spending for network upgrades and expansion and
the reclassification of shared information technology costs
partially offset by certain network assets becoming fully
depreciated.
Equity in net income (loss) of affiliates for the Wireless
segment includes expenses for ISIS, our mobile payment
joint venture with Verizon and T-Mobile.
The increase in 2011 was primarily due to the following:
• Higher volumes of smartphone sales and handset
upgrades, as well as handsets provided to former Alltel
Wireless (Alltel) subscribers, increased equipment costs
$2,816 and related commission expenses $1,079.
• Network system, interconnect, and long-distance costs
increased $1,356 due to higher network traffic, higher
recurring personnel-related network support costs in
conjunction with our network enhancement efforts,
and higher leasing costs.
• Selling expenses (other than commissions) increased
$288 due to higher payroll and benefit costs and a
$136 increase in bad debt expense, partially offset by
lower advertising and costs associated with customer
billing functions.
Partially offsetting these increases in 2011 were the
following:
• Incollect roaming, handset insurance costs, and USF fees
decreased $220 primarily due to lower usage and claims
on less expensive devices, less the impact of a USF rate
increase. A majority of USF fees are recovered and
reported as revenues.
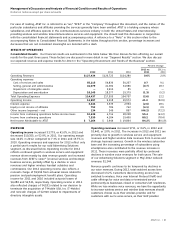
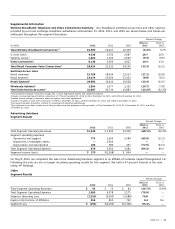
Wireline
Segment Results
Percent Change
2012 vs. 2011 vs.
2012 2011 2010 2011 2010
Segment operating revenues
Data $31,798 $29,560 $27,512 7.6% 7.4%
Voice 22,619 25,126 28,332 (10.0) (11.3)
Other 5,150 5,454 5,917 (5.6) (7.8)
Total Segment Operating Revenues 59,567 60,140 61,761 (1.0) (2.6)
Segment operating expenses
Operations and support 41,207 41,360 41,879 (0.4) (1.2)
Depreciation and amortization 11,123 11,615 12,372 (4.2) (6.1)
Total Segment Operating Expenses 52,330 52,975 54,251 (1.2) (2.4)
Segment Operating Income 7,237 7,165 7,510 1.0 (4.6)
Equity in Net Income of Affiliates (2) — 11 — —
Segment Income $ 7,235 $ 7,165 $ 7,521 1.0% (4.7)%
Operating Results
Our Wireline segment operating income margin was 12.1%
in 2012, compared to 11.9% in 2011 and 12.2% in 2010.
Our Wireline segment operating income increased $72, or
1.0%, in 2012 and decreased $345, or 4.6%, in 2011.
The increases in operating income and margins in 2012
reflect increases in data revenue growth and lower
depreciation and amortization expense, partially offset
by continued access line declines as our consumer and
business customers either reduced usage or disconnected
traditional landline services and switched to alternative
technologies, such as wireless and VoIP. Our strategy is to
offset these line losses by increasing non-access-line-related
revenues from customer connections for data, video and
U-verse voice. Additionally, we have the opportunity to
increase Wireless segment revenues if customers choose
us as their wireless provider.