AT&T Wireless 2012 Annual Report Download - page 70
Download and view the complete annual report
Please find page 70 of the 2012 AT&T Wireless annual report below. You can navigate through the pages in the report by either clicking on the pages listed below, or by using the keyword search tool below to find specific information within the annual report.-
 1
1 -
2
-
3
-
4
-
5
-
6
-
7
-
8
-
9
-
10
-
11
-
12
-
13
-
14
-
15
-
16
-
17
-
18
-
19
-
20
-
21
-
22
-
23
-
24
-
25
-
26
-
27
-
28
-
29
-
30
-
31
-
32
-
33
-
34
-
35
-
36
-
37
-
38
-
39
-
40
-
41
-
42
-
43
-
44
-
45
-
46
-
47
-
48
-
49
-
50
-
51
-
52
-
53
-
54
-
55
-
56
-
57
-
58
-
59
-
 60
60 -
 61
61 -
 62
62 -
 63
63 -
 64
64 -
 65
65 -
 66
66 -
 67
67 -
 68
68 -
 69
69 -
 70
70 -
 71
71 -
 72
72 -
 73
73 -
 74
74 -
 75
75 -
 76
76 -
 77
77 -
 78
78 -
 79
79 -
 80
80 -
81
-
82
-
83
-
84
-
85
-
86
-
87
-
88
-
89
-
90
-
91
-
92
-
93
-
94
-
95
-
96
-
97
-
98
-
99
-
100
 |
 |

Notes to Consolidated Financial Statements (continued)
Dollars in millions except per share amounts
68 | AT&T Inc.
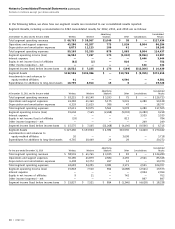
In the following tables, we show how our segment results are reconciled to our consolidated results reported.
Segment Results, including a reconciliation to AT&T consolidated results, for 2012, 2011, and 2010 are as follows:
Advertising Consolidated
At December 31, 2012 and for the year ended Wireless Wireline Solutions Other Consolidations Results
Total segment operating revenues $ 66,763 $ 59,567 $1,049 $ 55 $ — $127,434
Operations and support expenses 43,296 41,207 773 1,024 9,994 96,294
Depreciation and amortization expenses 6,873 11,123 106 41 — 18,143
Total segment operating expenses 50,169 52,330 879 1,065 9,994 114,437
Segment operating income (loss) 16,594 7,237 170 (1,010) (9,994) 12,997
Interest expense — — — — 3,444 3,444
Equity in net income (loss) of affiliates (62) (2) — 816 — 752
Other income (expense) – net — — — — 134 134
Segment income (loss) before income taxes $ 16,532 $ 7,235 $ 170 $ (194) $(13,304) $ 10,439
Segment Assets $132,556 $134,386 $ — $10,728 $ (5,355) $272,315
Investments in and advances to
equity method affiliates 41 — — 4,540 — 4,581
Expenditures for additions to long-lived assets 10,795 8,914 13 6 — 19,728
Advertising Consolidated
At December 31, 2011 and for the year ended Wireless Wireline Solutions Other Consolidations Results
Total segment operating revenues $ 63,215 $ 60,140 $ 3,293 $ 75 $ — $ 126,723
Operations and support expenses 41,282 41,360 5,175 5,031 6,280 99,128
Depreciation and amortization expenses 6,329 11,615 386 47 — 18,377
Total segment operating expenses 47,611 52,975 5,561 5,078 6,280 117,505
Segment operating income (loss) 15,604 7,165 (2,268) (5,003) (6,280) 9,218
Interest expense — — — — 3,535 3,535
Equity in net income (loss) of affiliates (29) — — 813 — 784
Other income (expense) – net — — — — 249 249
Segment income (loss) before income taxes $ 15,575 $ 7,165 $(2,268) $ (4,190) $ (9,566) $ 6,716
Segment Assets $ 127,466 $ 133,904 $ 2,982 $10,530 $ (4,440) $ 270,442
Investments in and advances to
equity method affiliates 20 — — 3,698 — 3,718
Expenditures for additions to long-lived assets 9,765 10,449 29 29 — 20,272
Advertising Consolidated
For the year ended December 31, 2010 Wireless Wireline Solutions Other Consolidations Results
Total segment operating revenues $ 58,501 $ 61,761 $ 3,935 $ 83 $ — $ 124,280
Operations and support expenses 36,185 41,879 2,584 2,159 2,521 85,328
Depreciation and amortization expenses 6,498 12,372 497 12 — 19,379
Total segment operating expenses 42,683 54,251 3,081 2,171 2,521 104,707
Segment operating income (loss) 15,818 7,510 854 (2,088) (2,521) 19,573
Interest expense — — — — 2,994 2,994
Equity in net income of affiliates 9 11 — 742 — 762
Other income (expense) – net — — — — 897 897
Segment income (loss) before income taxes $ 15,827 $ 7,521 $ 854 $ (1,346) $ (4,618) $ 18,238