AT&T Wireless 2012 Annual Report Download - page 76
Download and view the complete annual report
Please find page 76 of the 2012 AT&T Wireless annual report below. You can navigate through the pages in the report by either clicking on the pages listed below, or by using the keyword search tool below to find specific information within the annual report.-
 1
1 -
2
-
3
-
4
-
5
-
6
-
7
-
8
-
9
-
10
-
11
-
12
-
13
-
14
-
15
-
16
-
17
-
18
-
19
-
20
-
21
-
22
-
23
-
24
-
25
-
26
-
27
-
28
-
29
-
30
-
31
-
32
-
33
-
34
-
35
-
36
-
37
-
38
-
39
-
40
-
41
-
42
-
43
-
44
-
45
-
46
-
47
-
48
-
49
-
50
-
51
-
52
-
53
-
54
-
55
-
56
-
57
-
58
-
59
-
60
-
61
-
62
-
63
-
64
-
65
-
 66
66 -
 67
67 -
 68
68 -
 69
69 -
 70
70 -
 71
71 -
 72
72 -
 73
73 -
 74
74 -
 75
75 -
 76
76 -
 77
77 -
 78
78 -
 79
79 -
 80
80 -
 81
81 -
 82
82 -
 83
83 -
 84
84 -
 85
85 -
 86
86 -
87
-
88
-
89
-
90
-
91
-
92
-
93
-
94
-
95
-
96
-
97
-
98
-
99
-
100
 |
 |

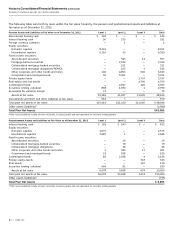
Notes to Consolidated Financial Statements (continued)
Dollars in millions except per share amounts
74 | AT&T Inc.
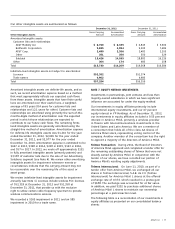
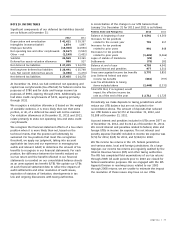
Investment Securities
Our investment securities include equities, fixed income
bonds and other securities. A substantial portion of the fair
values of our available-for-sale securities were estimated
based on quoted market prices. Investments in securities not
traded on a national securities exchange are valued using
pricing models, quoted prices of securities with similar
characteristics or discounted cash flows. Realized gains and
losses on securities are included in “Other income (expense)
– net” in the consolidated statements of income using the
specific identification method. Unrealized gains and losses,
net of tax, on available-for-sale securities are recorded in
accumulated OCI. Unrealized losses that are considered other
than temporary are recorded in “Other income (expense) –
net” with the corresponding reduction to the carrying basis
of the investment. Fixed income investments of $86 have
maturities of less than one year, $280 within one to three
years, $210 within three to five years, and $261 for five or
more years, which approximate fair value.
Our short-term investments (including money market
securities) and customer deposits are recorded at amortized
cost, and the respective carrying amounts approximate
fair values.
Our investment securities maturing within one year are
recorded in “Other current assets,” and instruments with
maturities of more than one year are recorded in “Other
Assets” on the consolidated balance sheets.
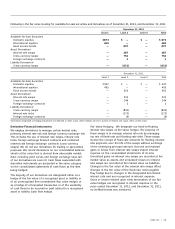
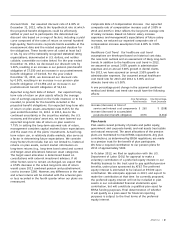
The fair value measurements level of an asset or liability within
the fair value hierarchy is based on the lowest level of any
input that is significant to the fair value measurement. Valuation
techniques used should maximize the use of observable inputs
and minimize the use of unobservable inputs.
The valuation methodologies described above may produce a
fair value calculation that may not be indicative of future net
realizable value or reflective of future fair values. We believe
our valuation methods are appropriate and consistent with
other market participants. The use of different methodologies
or assumptions to determine the fair value of certain financial
instruments could result in a different fair value measurement
at the reporting date. There have been no changes in the
methodologies used since December 31, 2011.
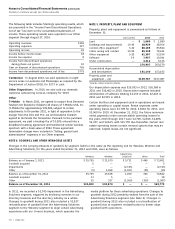
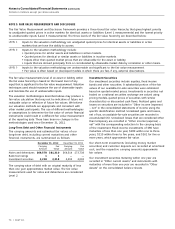
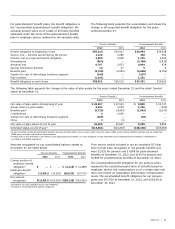
Long-Term Debt and Other Financial Instruments
The carrying amounts and estimated fair values of our
long-term debt, including current maturities and other
financial instruments, are summarized as follows:
December 31, 2012 December 31, 2011
Carrying Fair Carrying Fair
Amount Value Amount Value
Notes and debentures $69,578 $81,310 $64,514 $73,738
Bank borrowings 1 1 — —
Investment securities 2,218 2,218 2,092 2,092
The carrying value of debt with an original maturity of less
than one year approximates market value. The fair value
measurement used for notes and debentures are considered
Level 2.
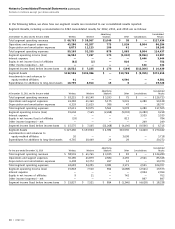
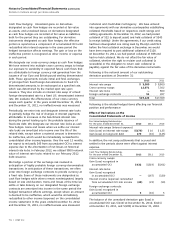
NOTE 9. FAIR VALUE MEASUREMENTS AND DISCLOSURE
The Fair Value Measurement and Disclosure framework provides a three-tiered fair value hierarchy that gives highest priority
to unadjusted quoted prices in active markets for identical assets or liabilities (Level 1 measurements) and the lowest priority
to unobservable inputs (Level 3 measurements). The three levels of the fair value hierarchy are described below:
LEVEL 1 Inputs to the valuation methodology are unadjusted quoted prices for identical assets or liabilities in active
markets that we have the ability to access.
LEVEL 2 Inputs to the valuation methodology include:
• Quoted prices for similar assets and liabilities in active markets.
• Quoted prices for identical or similar assets or liabilities in inactive markets.
• Inputs other than quoted market prices that are observable for the asset or liability.
• Inputs that are derived principally from or corroborated by observable market data by correlation or other means.
LEVEL 3 Inputs to the valuation methodology are unobservable and significant to the fair value measurement.
• Fair value is often based on developed models in which there are few, if any, external observations.