AT&T Wireless 2012 Annual Report Download - page 64
Download and view the complete annual report
Please find page 64 of the 2012 AT&T Wireless annual report below. You can navigate through the pages in the report by either clicking on the pages listed below, or by using the keyword search tool below to find specific information within the annual report.-
 1
1 -
2
-
3
-
4
-
5
-
6
-
7
-
8
-
9
-
10
-
11
-
12
-
13
-
14
-
15
-
16
-
17
-
18
-
19
-
20
-
21
-
22
-
23
-
24
-
25
-
26
-
27
-
28
-
29
-
30
-
31
-
32
-
33
-
34
-
35
-
36
-
37
-
38
-
39
-
40
-
41
-
42
-
43
-
44
-
45
-
46
-
47
-
48
-
49
-
50
-
51
-
52
-
53
-
 54
54 -
 55
55 -
 56
56 -
 57
57 -
 58
58 -
 59
59 -
 60
60 -
 61
61 -
 62
62 -
 63
63 -
 64
64 -
 65
65 -
 66
66 -
 67
67 -
 68
68 -
 69
69 -
 70
70 -
 71
71 -
 72
72 -
 73
73 -
 74
74 -
75
-
76
-
77
-
78
-
79
-
80
-
81
-
82
-
83
-
84
-
85
-
86
-
87
-
88
-
89
-
90
-
91
-
92
-
93
-
94
-
95
-
96
-
97
-
98
-
99
-
100
 |
 |

62 | AT&T Inc.
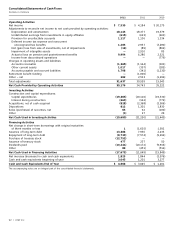
Consolidated Statements of Cash Flows
Dollars in millions
2012 2011 2010
Operating Activities
Net income $ 7,539 $ 4,184 $ 20,179
Adjustments to reconcile net income to net cash provided by operating activities:
Depreciation and amortization 18,143 18,377 19,379
Undistributed earnings from investments in equity affiliates (615) (623) (603)
Provision for uncollectible accounts 1,117 1,136 1,334
Deferred income tax expense and noncurrent
unrecognized tax benefits 1,285 2,937 (3,280)
Net (gain) loss from sale of investments, net of impairments (19) (89) (802)
Impairment of intangible assets — 2,910 85
Actuarial loss on pension and postretirement benefits 9,994 6,280 2,521
Income from discontinued operations — — (779)
Changes in operating assets and liabilities:
Accounts receivable (1,365) (1,164) (101)
Other current assets 1,017 (397) (185)
Accounts payable and accrued liabilities 1,798 (341) (1,230)
Retirement benefit funding — (1,000) —
Other − net 282 2,533 (1,296)
Total adjustments 31,637 30,559 15,043
Net Cash Provided by Operating Activities 39,176 34,743 35,222
Investing Activities
Construction and capital expenditures:
Capital expenditures (19,465) (20,110) (19,530)
Interest during construction (263) (162) (772)
Acquisitions, net of cash acquired (828) (2,368) (2,906)
Dispositions 812 1,301 1,830
Sales (purchases) of securities, net 65 62 (100)
Other (1) 27 29
Net Cash Used in Investing Activities (19,680) (21,250) (21,449)
Financing Activities
Net change in short-term borrowings with original maturities
of three months or less 1 (1,625) 1,592
Issuance of long-term debt 13,486 7,936 2,235
Repayment of long-term debt (8,733) (7,574) (9,294)
Purchase of treasury stock (12,752) — —
Issuance of treasury stock 477 237 50
Dividends paid (10,241) (10,172) (9,916)
Other 89 (451) (516)
Net Cash Used in Financing Activities (17,673) (11,649) (15,849)
Net increase (decrease) in cash and cash equivalents 1,823 1,844 (2,076)
Cash and cash equivalents beginning of year 3,045 1,201 3,277
Cash and Cash Equivalents End of Year $ 4,868 $ 3,045 $ 1,201
The accompanying notes are an integral part of the consolidated financial statements.