AT&T Wireless 2012 Annual Report Download - page 72
Download and view the complete annual report
Please find page 72 of the 2012 AT&T Wireless annual report below. You can navigate through the pages in the report by either clicking on the pages listed below, or by using the keyword search tool below to find specific information within the annual report.-
 1
1 -
2
-
3
-
4
-
5
-
6
-
7
-
8
-
9
-
10
-
11
-
12
-
13
-
14
-
15
-
16
-
17
-
18
-
19
-
20
-
21
-
22
-
23
-
24
-
25
-
26
-
27
-
28
-
29
-
30
-
31
-
32
-
33
-
34
-
35
-
36
-
37
-
38
-
39
-
40
-
41
-
42
-
43
-
44
-
45
-
46
-
47
-
48
-
49
-
50
-
51
-
52
-
53
-
54
-
55
-
56
-
57
-
58
-
59
-
60
-
61
-
 62
62 -
 63
63 -
 64
64 -
 65
65 -
 66
66 -
 67
67 -
 68
68 -
 69
69 -
 70
70 -
 71
71 -
 72
72 -
 73
73 -
 74
74 -
 75
75 -
 76
76 -
 77
77 -
 78
78 -
 79
79 -
 80
80 -
 81
81 -
 82
82 -
83
-
84
-
85
-
86
-
87
-
88
-
89
-
90
-
91
-
92
-
93
-
94
-
95
-
96
-
97
-
98
-
99
-
100
 |
 |

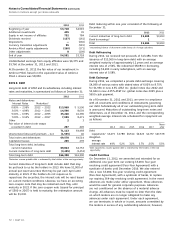
Notes to Consolidated Financial Statements (continued)
Dollars in millions except per share amounts
70 | AT&T Inc.
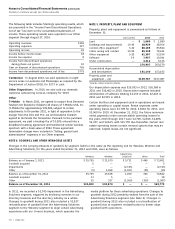
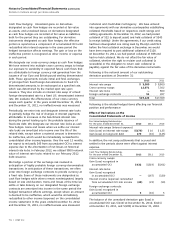
NOTE 5. PROPERTY, PLANT AND EQUIPMENT
Property, plant and equipment is summarized as follows at
December 31:
Lives (years) 2012 2011
Land — $ 1,689 $ 1,689
Buildings and improvements 10-45 28,939 28,054
Central office equipment1 3-10 86,185 83,824
Cable, wiring and conduit 10-50 80,338 78,431
Other equipment 5-20 61,387 53,104
Software 3-5 7,957 10,041
Under construction — 4,412 5,136
270,907 260,279
Accumulated depreciation
and amortization 161,140 153,192
Property, plant and
equipment – net $109,767 $107,087
1Includes certain network software.
Our depreciation expense was $16,933 in 2012, $16,368 in
2011 and $16,402 in 2010. Depreciation expense included
amortization of software totaling $2,130 in 2012, $2,243 in
2011 and $2,515 in 2010.
Certain facilities and equipment used in operations are leased
under operating or capital leases. Rental expenses under
operating leases were $3,709 for 2012, $3,610 for 2011, and
$3,060 for 2010. At December 31, 2012, the future minimum
rental payments under noncancelable operating leases for
the years 2013 through 2017 were $2,706, $2,616, $2,486,
$2,337, and $2,165, with $11,755 due thereafter. Certain real
estate operating leases contain renewal options that may be
exercised. Capital leases are not significant.
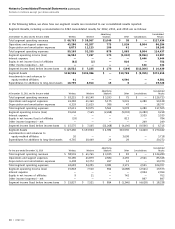
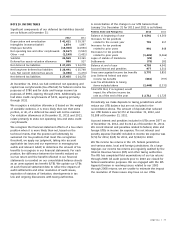
The following table includes Sterling’s operating results, which
are presented in the “Income From Discontinued Operations,
net of tax” line item on the consolidated statements of
income. These operating results were reported in our Other
segment through August 27, 2010:
Operating revenues $349
Operating expenses 327
Operating income 22
Income before income taxes 18
Income tax expense 8
Income from discontinued operations
during phase-out period 10
Gain on disposal of discontinued operations 769
Income from discontinued operations, net of tax $779
Centennial In August 2010, we sold operations in eight
service areas in Louisiana and Mississippi, as required by the
Department of Justice (DOJ), for $273 in cash.
Other Dispositions In 2010, we also sold our domestic
Japanese outsourcing services company for $109.
Other
T-Mobile In March 2011, we agreed to acquire from Deutsche
Telekom AG (Deutsche Telekom) all shares of T-Mobile USA, Inc.
(T-Mobile) for approximately $39,000, subject to certain
adjustments. In December 2011, in light of opposition to the
merger from the DOJ and FCC, we and Deutsche Telekom
agreed to terminate the transaction. Pursuant to the purchase
agreement, we paid a breakup fee of $3,000, entered into a
broadband roaming agreement and transferred certain wireless
spectrum with a book value of $962. These agreement
termination charges were included in “Selling, general and
administrative” expenses in our Other segment.
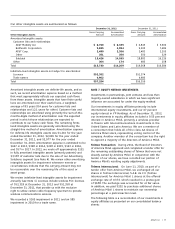
NOTE 6. GOODWILL AND OTHER INTANGIBLE ASSETS
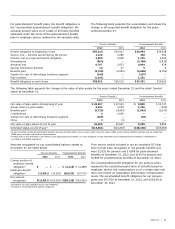
Changes in the carrying amounts of goodwill, by segment (which is the same as the reporting unit for Wireless, Wireline and
Advertising Solutions), for the years ended December 31, 2012 and 2011, were as follows:
Advertising
Wireless Wireline Solutions Other Total
Balance as of January 1, 2011 $ 35,755 $ 31,670 $ 5,731 $ 445 $ 73,601
Goodwill acquired 5 — — — 5
Impairments — — (2,745) — (2,745)
Other (5) 1,968 (1,927) (55) (19)
Balance as of December 31, 2011 35,755 33,638 1,059 390 70,842
Goodwill acquired 13 5 — — 18
Other 35 327 (1,059) (390) (1,087)
Balance as of December 31, 2012 $35,803 $33,970 $ — $ — $69,773
In 2011, we recorded a $2,745 impairment in the Advertising
Solutions segment, triggered by declining revenues in our
directory business and the directory industry as a whole.
Changes to goodwill during 2011 also included a $1,927
reclassification of goodwill from the Advertising Solutions
segment to the Wireline segment to align certain advertising
operations with our U-verse business, which operates the
media platform for those advertising operations. Changes to
goodwill during 2012 primarily resulted from the sale of the
Advertising Solutions segment (see Note 4). Changes in
goodwill during 2012 also included a reclassification of
goodwill due to segment reclassification to better align
goodwill with operations.