2K Sports 2008 Annual Report Download - page 53
Download and view the complete annual report
Please find page 53 of the 2008 2K Sports annual report below. You can navigate through the pages in the report by either clicking on the pages listed below, or by using the keyword search tool below to find specific information within the annual report.-
 1
1 -
2
-
3
-
4
-
5
-
6
-
7
-
8
-
9
-
10
-
11
-
12
-
13
-
14
-
15
-
16
-
17
-
18
-
19
-
20
-
21
-
22
-
23
-
24
-
25
-
26
-
27
-
28
-
29
-
30
-
31
-
32
-
33
-
34
-
35
-
36
-
37
-
38
-
39
-
40
-
41
-
42
-
 43
43 -
 44
44 -
 45
45 -
 46
46 -
 47
47 -
 48
48 -
 49
49 -
 50
50 -
 51
51 -
 52
52 -
 53
53 -
 54
54 -
 55
55 -
 56
56 -
 57
57 -
 58
58 -
 59
59 -
 60
60 -
 61
61 -
 62
62 -
 63
63 -
64
-
65
-
66
-
67
-
68
-
69
-
70
-
71
-
72
-
73
-
74
-
75
-
76
-
77
-
78
-
79
-
80
-
81
-
82
-
83
-
84
-
85
-
86
-
87
-
88
-
89
-
90
-
91
-
92
-
93
-
94
-
95
-
96
-
97
-
98
-
99
-
100
-
101
-
102
-
103
-
104
-
105
-
106
-
107
-
108
-
109
-
110
-
111
-
112
-
113
-
114
-
115
-
116
 |
 |

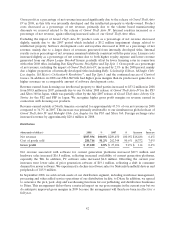
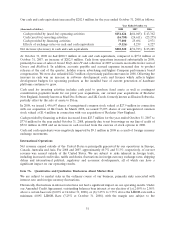
Foreign currency exchange rates increased net revenue by approximately $5.8 million in 2008, as a result of
a stronger Canadian dollar throughout most of 2008 and an increased proportion of international sales.
The decrease in gross margin mainly related to a $3.7 million write-down of inventory in 2008 in
conjunction with our plan to reduce the number of titles that we manage and distribute in order to focus
on higher gross margin products and improve the division’s operating efficiency. Excluding the write-down
of inventory, the gross margin would have increased to 10.0% in 2008, primarily due to increased bundling
of software with hardware.
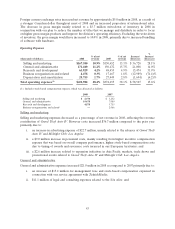
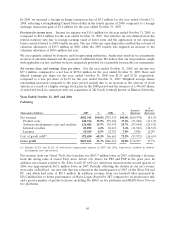
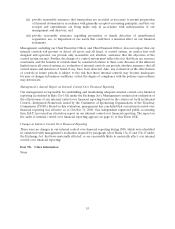
Operating Expenses
%
% of net % of net Increase/ Increase/
(thousands of dollars) 2008 revenue 2007 revenue (decrease) (decrease)
Selling and marketing $167,380 10.9% $130,652 13.3% $ 36,728 28.1%
General and administrative 171,440 11.2% 150,432 15.3% 21,008 14.0%
Research and development 63,929 4.2% 48,455 4.9% 15,474 31.9%
Business reorganization and related 4,478 0.3% 17,467 1.8% (12,989) (74.4)%
Depreciation and amortization 25,755 1.7% 27,449 2.8% (1,694) (6.2)%
Total operating expenses(1) $432,982 28.2% $374,455 38.1% $ 58,527 15.6%
(1) Includes stock-based compensation expense, which was allocated as follows:
2008 2007
Selling and marketing $ 2,370 $ 1,232
General and administrative 19,678 7,080
Research and development 4,878 3,735
Business reorganization and related —2,066
Selling and marketing
Selling and marketing expenses decreased as a percentage of net revenue in 2008, reflecting the revenue
contribution of Grand Theft Auto IV. However costs increased $36.7 million compared to the prior year
primarily due to:
i. an increase in advertising expense of $22.7 million, mainly related to the releases of Grand Theft
Auto IV and Midnight Club: Los Angeles;
ii. a $9.0 million increase in personnel costs, mainly resulting from higher incentive compensation
expense that was based on overall company performance, higher stock-based compensation costs
due to timing of awards and severance costs incurred in our European territories; and
iii. a $2.6 million increase related to expansion initiatives in Asia Pacific markets, trade shows and
promotional events related to Grand Theft Auto IV and Midnight Club: Los Angeles.
General and administrative
General and administrative expenses increased $21.0 million in 2008 as compared to 2007 primarily due to:
i. an increase of $15.2 million for management fees and stock-based compensation expensed in
connection with our service agreement with ZelnickMedia;
ii. $11.1 million of legal and consulting expenses related to the EA offer; and
43