2K Sports 2008 Annual Report Download - page 102
Download and view the complete annual report
Please find page 102 of the 2008 2K Sports annual report below. You can navigate through the pages in the report by either clicking on the pages listed below, or by using the keyword search tool below to find specific information within the annual report.-
 1
1 -
2
-
3
-
4
-
5
-
6
-
7
-
8
-
9
-
10
-
11
-
12
-
13
-
14
-
15
-
16
-
17
-
18
-
19
-
20
-
21
-
22
-
23
-
24
-
25
-
26
-
27
-
28
-
29
-
30
-
31
-
32
-
33
-
34
-
35
-
36
-
37
-
38
-
39
-
40
-
41
-
42
-
43
-
44
-
45
-
46
-
47
-
48
-
49
-
50
-
51
-
52
-
53
-
54
-
55
-
56
-
57
-
58
-
59
-
60
-
61
-
62
-
63
-
64
-
65
-
66
-
67
-
68
-
69
-
70
-
71
-
72
-
73
-
74
-
75
-
76
-
77
-
78
-
79
-
80
-
81
-
82
-
83
-
84
-
85
-
86
-
87
-
88
-
89
-
90
-
91
-
 92
92 -
 93
93 -
 94
94 -
 95
95 -
 96
96 -
 97
97 -
 98
98 -
 99
99 -
 100
100 -
 101
101 -
 102
102 -
 103
103 -
 104
104 -
 105
105 -
 106
106 -
 107
107 -
 108
108 -
 109
109 -
 110
110 -
 111
111 -
 112
112 -
113
-
114
-
115
-
116
 |
 |

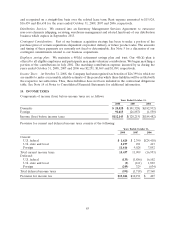
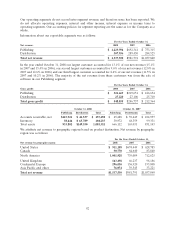
Our operating segments do not record inter-segment revenue and therefore none has been reported. We
do not allocate operating expenses, interest and other income, interest expense or income taxes to
operating segments. Our accounting policies for segment reporting are the same as for the Company as a
whole.
Information about our reportable segments was as follows:
For the Years Ended October 31,
Net revenue: 2008 2007 2006
Publishing $ 1,229,594 $692,341 $ 753,315
Distribution 307,936 289,450 284,525
Total net revenue $ 1,537,530 $981,791 $1,037,840
In the year ended October 31, 2008 our largest customer accounted for 13.1% of our net revenue (15.1%
in 2007 and 15.4% in 2006), our second largest customer accounted for 9.6% of our net revenue (12.8% in
2007 and 12.6% in 2006) and our third largest customer accounted for 8.6% of our net revenue (11.5% in
2007 and 10.2% in 2006). The majority of the net revenue from these customers was from the sale of
software in our Publishing segment.
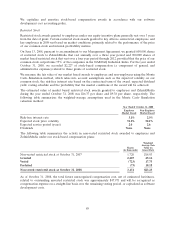
For the Years Ended October 31,
Gross profit: 2008 2007 2006
Publishing $ 521,615 $219,651 $ 186,654
Distribution 27,220 27,106 25,710
Total gross profit $ 548,835 $246,757 $ 212,364
October 31, 2008 October 31, 2007
Publishing Distribution Total Publishing Distribution Total
Accounts receivable, net $115,921 $ 41,537 $ 157,458 $ 65,288 $ 39,649 $ 104,937
Inventory 38,446 $ 65,789 104,235 30,972 68,359 99,331
Total assets 933,802 $149,550 1,083,352 666,112 165,031 831,143
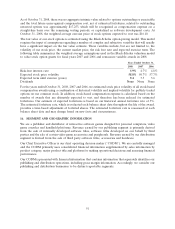
We attribute net revenue to geographic regions based on product destination. Net revenue by geographic
region was as follows:
For the Years Ended October 31,
Net revenue by geographic region: 2008 2007 2006
United States $ 911,158 $674,449 $ 628,785
Canada 90,770 64,640 83,840
North America 1,001,928 739,089 712,625
United Kingdom 163,498 66,237 98,186
Continental Europe 296,030 136,920 193,808
Asia Pacific and other 76,074 39,545 33,221
Total net revenue $1,537,530 $981,791 $1,037,840
92