2K Sports 2008 Annual Report Download - page 50
Download and view the complete annual report
Please find page 50 of the 2008 2K Sports annual report below. You can navigate through the pages in the report by either clicking on the pages listed below, or by using the keyword search tool below to find specific information within the annual report.-
 1
1 -
2
-
3
-
4
-
5
-
6
-
7
-
8
-
9
-
10
-
11
-
12
-
13
-
14
-
15
-
16
-
17
-
18
-
19
-
20
-
21
-
22
-
23
-
24
-
25
-
26
-
27
-
28
-
29
-
30
-
31
-
32
-
33
-
34
-
35
-
36
-
37
-
38
-
39
-
 40
40 -
 41
41 -
 42
42 -
 43
43 -
 44
44 -
 45
45 -
 46
46 -
 47
47 -
 48
48 -
 49
49 -
 50
50 -
 51
51 -
 52
52 -
 53
53 -
 54
54 -
 55
55 -
 56
56 -
 57
57 -
 58
58 -
 59
59 -
 60
60 -
61
-
62
-
63
-
64
-
65
-
66
-
67
-
68
-
69
-
70
-
71
-
72
-
73
-
74
-
75
-
76
-
77
-
78
-
79
-
80
-
81
-
82
-
83
-
84
-
85
-
86
-
87
-
88
-
89
-
90
-
91
-
92
-
93
-
94
-
95
-
96
-
97
-
98
-
99
-
100
-
101
-
102
-
103
-
104
-
105
-
106
-
107
-
108
-
109
-
110
-
111
-
112
-
113
-
114
-
115
-
116
 |
 |

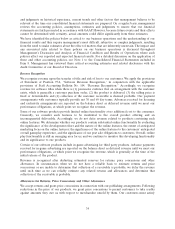
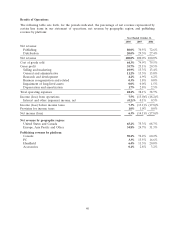
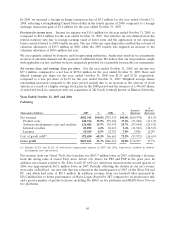
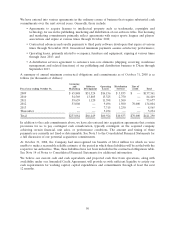
Results of Operations
The following table sets forth, for the periods indicated, the percentage of net revenue represented by
certain line items in our statement of operations, net revenue by geographic region, and publishing
revenue by platform:
Year Ended October 31,
2008 2007 2006
Net revenue:
Publishing 80.0% 70.5% 72.6%
Distribution 20.0% 29.5% 27.4%
Net revenue 100.0% 100.0% 100.0%
Cost of goods sold 64.3% 74.9% 79.5%
Gross profit 35.7% 25.1% 20.5%
Selling and marketing 10.9% 13.3% 13.4%
General and administrative 11.2% 15.3% 15.0%
Research and development 4.2% 4.9% 6.2%
Business reorganization and related 0.3% 1.8% 0.0%
Impairment of long-lived assets 0.0% 0.0% 1.5%
Depreciation and amortization 1.7% 2.8% 2.5%
Total operating expenses 28.2% 38.1% 38.7%
Income (loss) from operations 7.5% (13.0)% (18.2)%
Interest and other (expense) income, net (0.2)% 0.1% 0.5%
Income (loss) before income taxes 7.3% (13.1)% (17.8)%
Provision for income taxes 1.0% 1.0% 0.0%
Net income (loss) 6.3% (14.1)% (17.8)%
Net revenue by geographic region:
United States and Canada 65.2% 75.3% 68.7%
Europe, Asia Pacific and Other 34.8% 24.7% 31.3%
Publishing revenue by platform:
Console 90.2% 72.2% 60.2%
PC 3.3% 13.5% 16.6%
Handheld 6.4% 11.5% 20.0%
Accessories 0.1% 2.8% 3.2%
40