2K Sports 2008 Annual Report Download - page 105
Download and view the complete annual report
Please find page 105 of the 2008 2K Sports annual report below. You can navigate through the pages in the report by either clicking on the pages listed below, or by using the keyword search tool below to find specific information within the annual report.-
 1
1 -
2
-
3
-
4
-
5
-
6
-
7
-
8
-
9
-
10
-
11
-
12
-
13
-
14
-
15
-
16
-
17
-
18
-
19
-
20
-
21
-
22
-
23
-
24
-
25
-
26
-
27
-
28
-
29
-
30
-
31
-
32
-
33
-
34
-
35
-
36
-
37
-
38
-
39
-
40
-
41
-
42
-
43
-
44
-
45
-
46
-
47
-
48
-
49
-
50
-
51
-
52
-
53
-
54
-
55
-
56
-
57
-
58
-
59
-
60
-
61
-
62
-
63
-
64
-
65
-
66
-
67
-
68
-
69
-
70
-
71
-
72
-
73
-
74
-
75
-
76
-
77
-
78
-
79
-
80
-
81
-
82
-
83
-
84
-
85
-
86
-
87
-
88
-
89
-
90
-
91
-
92
-
93
-
94
-
 95
95 -
 96
96 -
 97
97 -
 98
98 -
 99
99 -
 100
100 -
 101
101 -
 102
102 -
 103
103 -
 104
104 -
 105
105 -
 106
106 -
 107
107 -
 108
108 -
 109
109 -
 110
110 -
 111
111 -
 112
112 -
 113
113 -
 114
114 -
 115
115 -
116
 |
 |

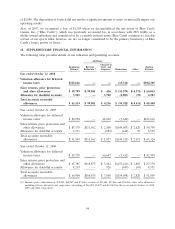
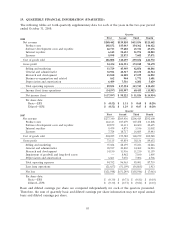
19. QUARTERLY FINANCIAL INFORMATION (UNAUDITED)
The following tables set forth quarterly supplementary data for each of the years in the two-year period
ended October 31, 2008:
Quarter
First Second Third Fourth
2008
Net revenue $240,442 $539,810 $433,836 $323,442
Product costs 148,152 185,043 154,362 146,422
Software development costs and royalties 22,713 57,688 45,721 43,276
Internal royalties 6,145 52,653 51,971 18,003
Licenses 8,998 22,875 7,602 17,071
Cost of goods sold 186,008 318,259 259,656 224,772
Gross profit 54,434 221,551 174,180 98,670
Selling and marketing 33,729 45,949 42,856 44,846
General and administrative 32,921 48,317 45,678 44,524
Research and development 15,810 14,828 17,239 16,052
Business reorganization and related 162 944 1,771 1,601
Depreciation and amortization 6,409 7,516 6,201 5,629
Total operating expenses 89,031 117,554 113,745 112,652
Income (loss) from operations (34,597) 103,997 60,435 (13,982)
Net income (loss) $ (37,997) $ 98,222 $ 51,826 $(14,954)
Per share data:
Basic—EPS $ (0.52) $ 1.31 $ 0.68 $ (0.20)
Diluted—EPS $ (0.52) $ 1.29 $ 0.67 $ (0.20)
Quarter
First Second Third Fourth
2007
Net revenue $277,340 $205,436 $206,415 $292,600
Product costs 164,143 105,679 107,458 133,808
Software development costs and royalties 22,879 30,311 40,600 42,695
Internal royalties 9,479 4,875 3,536 11,002
Licenses 7,724 18,717 16,685 15,443
Cost of goods sold 204,225 159,582 168,279 202,948
Gross profit 73,115 45,854 38,136 89,652
Selling and marketing 35,024 28,159 35,223 32,246
General and administrative 38,917 40,830 34,462 36,223
Research and development 14,150 11,936 11,210 11,159
Impairment of goodwill and long-lived assets — 8,962 7,100 1,405
Depreciation and amortization 6,661 7,076 7,006 6,706
Total operating expenses 94,752 96,963 95,001 87,739
Loss from operations (21,637) (51,109) (56,865) 1,913
Net loss $(21,548) $ (51,249) $(58,546) $ (7,063)
Per share data:
Basic—EPS $ (0.30) $ (0.71) $ (0.81) $ (0.10)
Diluted—EPS $ (0.30) $ (0.71) $ (0.81) $ (0.10)
Basic and diluted earnings per share are computed independently for each of the quarters presented.
Therefore, the sum of quarterly basic and diluted earnings per share information may not equal annual
basic and diluted earnings per share.
95