2K Sports 2008 Annual Report Download - page 101
Download and view the complete annual report
Please find page 101 of the 2008 2K Sports annual report below. You can navigate through the pages in the report by either clicking on the pages listed below, or by using the keyword search tool below to find specific information within the annual report.-
 1
1 -
2
-
3
-
4
-
5
-
6
-
7
-
8
-
9
-
10
-
11
-
12
-
13
-
14
-
15
-
16
-
17
-
18
-
19
-
20
-
21
-
22
-
23
-
24
-
25
-
26
-
27
-
28
-
29
-
30
-
31
-
32
-
33
-
34
-
35
-
36
-
37
-
38
-
39
-
40
-
41
-
42
-
43
-
44
-
45
-
46
-
47
-
48
-
49
-
50
-
51
-
52
-
53
-
54
-
55
-
56
-
57
-
58
-
59
-
60
-
61
-
62
-
63
-
64
-
65
-
66
-
67
-
68
-
69
-
70
-
71
-
72
-
73
-
74
-
75
-
76
-
77
-
78
-
79
-
80
-
81
-
82
-
83
-
84
-
85
-
86
-
87
-
88
-
89
-
90
-
 91
91 -
 92
92 -
 93
93 -
 94
94 -
 95
95 -
 96
96 -
 97
97 -
 98
98 -
 99
99 -
 100
100 -
 101
101 -
 102
102 -
 103
103 -
 104
104 -
 105
105 -
 106
106 -
 107
107 -
 108
108 -
 109
109 -
 110
110 -
 111
111 -
112
-
113
-
114
-
115
-
116
 |
 |

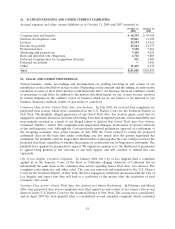
As of October 31, 2008, there was no aggregate intrinsic value related to options outstanding or exercisable
and the total future unrecognized compensation cost, net of estimated forfeitures, related to outstanding
unvested options was approximately $17,253, which will be recognized as compensation expense on a
straight-line basis over the remaining vesting periods, or capitalized as software development costs. At
October 31, 2008, the weighted average exercise price of stock options expected to vest was $16.10.
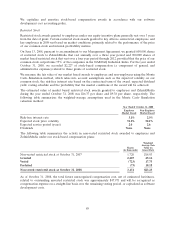
The fair value of our stock options is estimated using the Black-Scholes option-pricing model. This model
requires the input of assumptions regarding a number of complex and subjective variables that will usually
have a significant impact on the fair value estimate. These variables include, but are not limited to, the
volatility of our stock price, the current market price, the risk free rate and expected exercise term. The
following table summarizes the weighted average assumptions used in the Black-Scholes valuation model
to value stock option grants for fiscal years 2007 and 2006 and remeasure variable awards in 2008:
Years Ended October 31,
2008 2007 2006
Risk-free interest rate 3.9% 4.7% 4.8%
Expected stock price volatility 58.8% 50.7% 57.7%
Expected term until exercise (years) 9.4 3.5 3.6
Dividends None None None
For the years ended October 31, 2008, 2007 and 2006, we estimated stock price volatility of all stock-based
compensation awards using a combination of historical volatility and implied volatility for publicly traded
options on our common stock. In addition, stock-based compensation expense is calculated based on the
number of awards that are ultimately expected to vest, and therefore has been reduced for estimated
forfeitures. Our estimate of expected forfeitures is based on our historical annual forfeiture rate of 5%.
The estimated forfeiture rate, which is evaluated each balance sheet date throughout the life of the award,
provides a time-based adjustment of forfeited shares. The estimated forfeiture rate is reassessed at each
balance sheet date and may change based on new facts and circumstances.
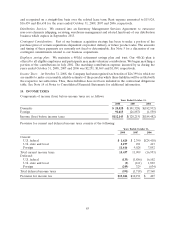
16. SEGMENT AND GEOGRAPHIC INFORMATION
We are a publisher and distributor of interactive software games designed for personal computers, video
game consoles and handheld platforms. Revenue earned by our publishing segment is primarily derived
from the sale of internally developed software titles, software titles developed on our behalf by third
parties and the sale of certain video game accessories and peripherals. Revenue earned by our distribution
segment is derived from the sale of third party software titles, accessories and hardware.
Our Chief Executive Officer is our chief operating decision maker (‘‘CODM’’). We are centrally managed
and the CODM primarily uses consolidated financial information supplemented by sales information by
product category, major product title and platform for making operational decisions and assessing financial
performance.
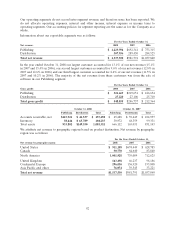
Our CODM is presented with financial information that contains information that separately identifies our
publishing and distribution operations, including gross margin information. Accordingly, we consider our
publishing and distribution businesses to be distinct reportable segments.
91