PNC Bank 2013 Annual Report Download - page 95
Download and view the complete annual report
Please find page 95 of the 2013 PNC Bank annual report below. You can navigate through the pages in the report by either clicking on the pages listed below, or by using the keyword search tool below to find specific information within the annual report.-
 1
1 -
2
-
3
-
4
-
5
-
6
-
7
-
8
-
9
-
10
-
11
-
12
-
13
-
14
-
15
-
16
-
17
-
18
-
19
-
20
-
21
-
22
-
23
-
24
-
25
-
26
-
27
-
28
-
29
-
30
-
31
-
32
-
33
-
34
-
35
-
36
-
37
-
38
-
39
-
40
-
41
-
42
-
43
-
44
-
45
-
46
-
47
-
48
-
49
-
50
-
51
-
52
-
53
-
54
-
55
-
56
-
57
-
58
-
59
-
60
-
61
-
62
-
63
-
64
-
65
-
66
-
67
-
68
-
69
-
70
-
71
-
72
-
73
-
74
-
75
-
76
-
77
-
78
-
79
-
80
-
81
-
82
-
83
-
84
-
 85
85 -
 86
86 -
 87
87 -
 88
88 -
 89
89 -
 90
90 -
 91
91 -
 92
92 -
 93
93 -
 94
94 -
 95
95 -
 96
96 -
 97
97 -
 98
98 -
 99
99 -
 100
100 -
 101
101 -
 102
102 -
 103
103 -
 104
104 -
 105
105 -
106
-
107
-
108
-
109
-
110
-
111
-
112
-
113
-
114
-
115
-
116
-
117
-
118
-
119
-
120
-
121
-
122
-
123
-
124
-
125
-
126
-
127
-
128
-
129
-
130
-
131
-
132
-
133
-
134
-
135
-
136
-
137
-
138
-
139
-
140
-
141
-
142
-
143
-
144
-
145
-
146
-
147
-
148
-
149
-
150
-
151
-
152
-
153
-
154
-
155
-
156
-
157
-
158
-
159
-
160
-
161
-
162
-
163
-
164
-
165
-
166
-
167
-
168
-
169
-
170
-
171
-
172
-
173
-
174
-
175
-
176
-
177
-
178
-
179
-
180
-
181
-
182
-
183
-
184
-
185
-
186
-
187
-
188
-
189
-
190
-
191
-
192
-
193
-
194
-
195
-
196
-
197
-
198
-
199
-
200
-
201
-
202
-
203
-
204
-
205
-
206
-
207
-
208
-
209
-
210
-
211
-
212
-
213
-
214
-
215
-
216
-
217
-
218
-
219
-
220
-
221
-
222
-
223
-
224
-
225
-
226
-
227
-
228
-
229
-
230
-
231
-
232
-
233
-
234
-
235
-
236
-
237
-
238
-
239
-
240
-
241
-
242
-
243
-
244
-
245
-
246
-
247
-
248
-
249
-
250
-
251
-
252
-
253
-
254
-
255
-
256
-
257
-
258
-
259
-
260
-
261
-
262
-
263
-
264
-
265
-
266
 |
 |

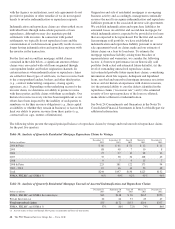
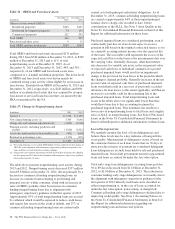
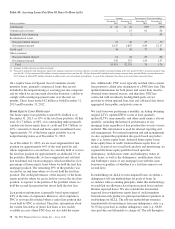
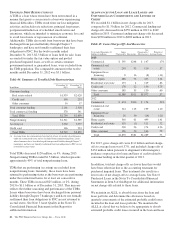
Accruing loans past due 90 days or more are referred to as late stage delinquencies. These loans are not included in nonperforming
loans and continue to accrue interest because they are well secured by collateral, and/or are in the process of collection, or are
managed in homogenous portfolios with specified charge-off timeframes adhering to regulatory guidelines. These loans decreased
$.9 billion, or 37%, from $2.4 billion at December 31, 2012, to $1.5 billion at December 31, 2013, mainly due to a decline in
government insured residential real estate loans of $.8 billion, the majority of which we took possession of and conveyed the real
estate, or are in the process of conveyance and claim resolution. Additionally, late stage delinquencies decreased $.3 billion due to
the alignment with interagency supervisory guidance in the first quarter of 2013 in which loans were moved to either
nonperforming or, in the case of loans accounted for under the fair value option, nonaccruing, or charged-off. The following tables
display the delinquency status of our loans at December 31, 2013 and December 31, 2012. Additional information regarding
accruing loans past due is included in Note 5 Asset Quality in the Notes To Consolidated Financial Statements in Item 8 of this
Report.
Table 38: Accruing Loans Past Due 30 To 59 Days (a)(b)
Dollars in millions
Amount Percentage of Total Outstandings
December 31
2013
December 31
2012
December 31
2013
December 31
2012
Commercial $ 81 $115 .09% .14%
Commercial real estate 54 100 .25 .54
Equipment lease financing 31 17 .41 .23
Home equity 86 117 .24 .33
Residential real estate
Non government insured 112 151 .74 .99
Government insured 105 127 .70 .83
Credit card 29 34 .66 .79
Other consumer
Non government insured 62 65 .28 .30
Government insured 154 193 .68 .90
Total $714 $919 .37 .49
(a) See note (a) at Table 40: Accruing Loans Past Due 90 Days Or More.
(b) See note (b) at Table 40: Accruing Loans Past Due 90 Days Or More.
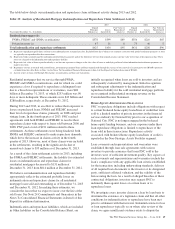
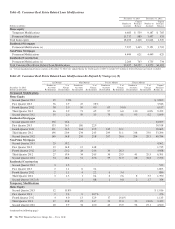
Table 39: Accruing Loans Past Due 60 To 89 Days (a)(b)
Amount Percentage of Total Outstandings
Dollars in millions
December 31
2013
December 31
2012
December 31
2013
December 31
2012
Commercial $ 20 $ 55 .02% .07%
Commercial real estate 11 57 .05 .31
Equipment lease financing 2 1 .03 .01
Home equity 34 58 .09 .16
Residential real estate
Non government insured 30 49 .20 .32
Government insured 57 97 .38 .64
Credit card 19 23 .43 .53
Other consumer
Non government insured 18 21 .08 .10
Government insured 94 110 .42 .51
Total $285 $471 .15 .25
(a) See note (a) at Table 40: Accruing Loans Past Due 90 Days Or More.
(b) See note (b) at Table 40: Accruing Loans Past Due 90 Days Or More.
The PNC Financial Services Group, Inc. – Form 10-K 77