PNC Bank 2013 Annual Report Download - page 163
Download and view the complete annual report
Please find page 163 of the 2013 PNC Bank annual report below. You can navigate through the pages in the report by either clicking on the pages listed below, or by using the keyword search tool below to find specific information within the annual report.-
 1
1 -
2
-
3
-
4
-
5
-
6
-
7
-
8
-
9
-
10
-
11
-
12
-
13
-
14
-
15
-
16
-
17
-
18
-
19
-
20
-
21
-
22
-
23
-
24
-
25
-
26
-
27
-
28
-
29
-
30
-
31
-
32
-
33
-
34
-
35
-
36
-
37
-
38
-
39
-
40
-
41
-
42
-
43
-
44
-
45
-
46
-
47
-
48
-
49
-
50
-
51
-
52
-
53
-
54
-
55
-
56
-
57
-
58
-
59
-
60
-
61
-
62
-
63
-
64
-
65
-
66
-
67
-
68
-
69
-
70
-
71
-
72
-
73
-
74
-
75
-
76
-
77
-
78
-
79
-
80
-
81
-
82
-
83
-
84
-
85
-
86
-
87
-
88
-
89
-
90
-
91
-
92
-
93
-
94
-
95
-
96
-
97
-
98
-
99
-
100
-
101
-
102
-
103
-
104
-
105
-
106
-
107
-
108
-
109
-
110
-
111
-
112
-
113
-
114
-
115
-
116
-
117
-
118
-
119
-
120
-
121
-
122
-
123
-
124
-
125
-
126
-
127
-
128
-
129
-
130
-
131
-
132
-
133
-
134
-
135
-
136
-
137
-
138
-
139
-
140
-
141
-
142
-
143
-
144
-
145
-
146
-
147
-
148
-
149
-
150
-
151
-
152
-
 153
153 -
 154
154 -
 155
155 -
 156
156 -
 157
157 -
 158
158 -
 159
159 -
 160
160 -
 161
161 -
 162
162 -
 163
163 -
 164
164 -
 165
165 -
 166
166 -
 167
167 -
 168
168 -
 169
169 -
 170
170 -
 171
171 -
 172
172 -
 173
173 -
174
-
175
-
176
-
177
-
178
-
179
-
180
-
181
-
182
-
183
-
184
-
185
-
186
-
187
-
188
-
189
-
190
-
191
-
192
-
193
-
194
-
195
-
196
-
197
-
198
-
199
-
200
-
201
-
202
-
203
-
204
-
205
-
206
-
207
-
208
-
209
-
210
-
211
-
212
-
213
-
214
-
215
-
216
-
217
-
218
-
219
-
220
-
221
-
222
-
223
-
224
-
225
-
226
-
227
-
228
-
229
-
230
-
231
-
232
-
233
-
234
-
235
-
236
-
237
-
238
-
239
-
240
-
241
-
242
-
243
-
244
-
245
-
246
-
247
-
248
-
249
-
250
-
251
-
252
-
253
-
254
-
255
-
256
-
257
-
258
-
259
-
260
-
261
-
262
-
263
-
264
-
265
-
266
 |
 |
N
OTE
6P
URCHASED
L
OANS
P
URCHASED
I
MPAIRED
L
OANS
Purchased impaired loan accounting addresses differences
between contractual cash flows and cash flows expected to be
collected from the initial investment in loans if those
differences are attributable, at least in part, to credit quality.
Several factors were considered when evaluating whether a
loan was considered a purchased impaired loan, including the
delinquency status of the loan, updated borrower credit status,
geographic information, and updated loan-to-values (LTV).
GAAP allows purchasers to aggregate purchased impaired
loans acquired in the same fiscal quarter into one or more
pools, provided that the loans have common risk
characteristics. A pool is then accounted for as a single asset
with a single composite interest rate and an aggregate
expectation of cash flows. Purchased impaired homogeneous
consumer, residential real estate and smaller balance
commercial loans with common risk characteristics are
aggregated into pools where appropriate. Commercial loans
with a total commitment greater than a defined threshold are
accounted for individually. The excess of undiscounted cash
flows expected at acquisition over the estimated fair value is
referred to as the accretable yield and is recognized as interest
income over the remaining life of the loan using the constant
effective yield method. The difference between contractually
required payments at acquisition and the cash flows expected
to be collected at acquisition is referred to as the
nonaccretable difference. Subsequent changes in the expected
cash flows of individual or pooled purchased impaired loans
from the date of acquisition will either impact the accretable
yield or result in an impairment charge to provision for credit
losses in the period in which the changes become probable.
Decreases to the net present value of expected cash flows will
generally result in an impairment charge recorded as a
provision for credit losses, resulting in an increase to the
allowance for loan and lease losses, and a reclassification
from accretable yield to nonaccretable difference.
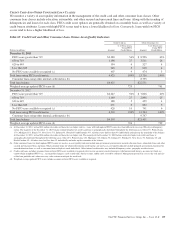
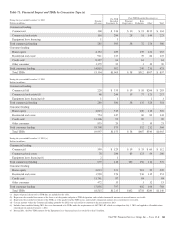
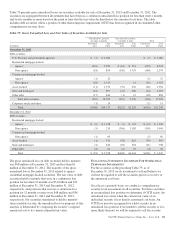
The following table provides purchased impaired loans at December 31, 2013 and December 31, 2012:
Table 74: Purchased Impaired Loans – Balances
December 31, 2013 December 31, 2012
In millions
Outstanding
Balance
Recorded
Investment Carrying Value
Outstanding
Balance
Recorded
Investment Carrying Value
Commercial lending
Commercial $ 282 $ 157 $ 131 $ 524 $ 308 $ 276
Commercial real estate 655 516 409 1,156 941 734
Total commercial lending 937 673 540 1,680 1,249 1,010
Consumer lending
Consumer 2,523 2,312 1,971 2,988 2,621 2,336
Residential real estate 3,025 3,121 2,591 3,651 3,536 2,963
Total consumer lending 5,548 5,433 4,562 6,639 6,157 5,299
Total $6,485 $6,106 $5,102 $8,319 $7,406 $6,309
During 2013, $11 million of provision and $104 million of
charge-offs were recorded on purchased impaired loans. The
comparative amounts for 2012 were $173 million and $74
million, respectively. At December 31, 2013, the allowance
for loan and lease losses was $1.0 billion on $5.2 billion of
purchased impaired loans while the remaining $.9 billion of
purchased impaired loans required no allowance as the net
present value of expected cash flows equaled or exceeded the
recorded investment. As of December 31, 2012, the allowance
for loan and lease losses related to purchased impaired loans
was $1.1 billion. If any allowance for loan losses is
recognized on a purchased impaired pool, which is accounted
for as a single asset, the entire balance of that pool would be
disclosed as requiring an allowance. Subsequent increases in
the net present value of cash flows will result in a recovery of
any previously recorded allowance for loan and lease losses,
to the extent applicable, and/or a reclassification from non-
accretable difference to accretable yield, which will be
recognized prospectively. Disposals of loans, which may
include sales of loans or foreclosures, result in removal of the
loans for cash flow estimation purposes. The cash flow re-
estimation process is completed quarterly to evaluate the
appropriateness of the allowance associated with the
purchased impaired loans.
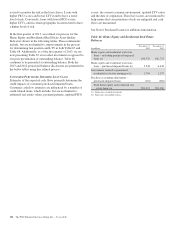
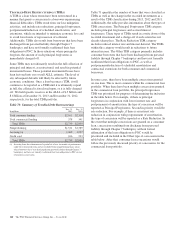
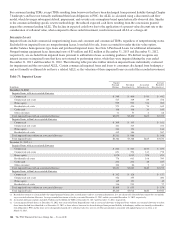
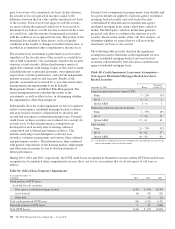
Activity for the accretable yield during 2013 follows:
Table 75: Purchased Impaired Loans – Accretable Yield
In millions 2013 2012
January 1 $2,166 $2,109
Addition of accretable yield due to RBC Bank
(USA) acquisition on March 2, 2012 587
Accretion (including excess cash recoveries) (695) (828)
Net reclassifications to accretable from non-
accretable (a) 613 327
Disposals (29) (29)
December 31 $2,055 $2,166
(a) Approximately 63% of the net reclassifications for the year were within the consumer
portfolio primarily due to increases in the expected average life of residential and
home equity loans. The remaining net reclassifications were predominantly due to
future cash flow improvements within the commercial portfolio.
The PNC Financial Services Group, Inc. – Form 10-K 145