PNC Bank 2013 Annual Report Download - page 247
Download and view the complete annual report
Please find page 247 of the 2013 PNC Bank annual report below. You can navigate through the pages in the report by either clicking on the pages listed below, or by using the keyword search tool below to find specific information within the annual report.-
 1
1 -
2
-
3
-
4
-
5
-
6
-
7
-
8
-
9
-
10
-
11
-
12
-
13
-
14
-
15
-
16
-
17
-
18
-
19
-
20
-
21
-
22
-
23
-
24
-
25
-
26
-
27
-
28
-
29
-
30
-
31
-
32
-
33
-
34
-
35
-
36
-
37
-
38
-
39
-
40
-
41
-
42
-
43
-
44
-
45
-
46
-
47
-
48
-
49
-
50
-
51
-
52
-
53
-
54
-
55
-
56
-
57
-
58
-
59
-
60
-
61
-
62
-
63
-
64
-
65
-
66
-
67
-
68
-
69
-
70
-
71
-
72
-
73
-
74
-
75
-
76
-
77
-
78
-
79
-
80
-
81
-
82
-
83
-
84
-
85
-
86
-
87
-
88
-
89
-
90
-
91
-
92
-
93
-
94
-
95
-
96
-
97
-
98
-
99
-
100
-
101
-
102
-
103
-
104
-
105
-
106
-
107
-
108
-
109
-
110
-
111
-
112
-
113
-
114
-
115
-
116
-
117
-
118
-
119
-
120
-
121
-
122
-
123
-
124
-
125
-
126
-
127
-
128
-
129
-
130
-
131
-
132
-
133
-
134
-
135
-
136
-
137
-
138
-
139
-
140
-
141
-
142
-
143
-
144
-
145
-
146
-
147
-
148
-
149
-
150
-
151
-
152
-
153
-
154
-
155
-
156
-
157
-
158
-
159
-
160
-
161
-
162
-
163
-
164
-
165
-
166
-
167
-
168
-
169
-
170
-
171
-
172
-
173
-
174
-
175
-
176
-
177
-
178
-
179
-
180
-
181
-
182
-
183
-
184
-
185
-
186
-
187
-
188
-
189
-
190
-
191
-
192
-
193
-
194
-
195
-
196
-
197
-
198
-
199
-
200
-
201
-
202
-
203
-
204
-
205
-
206
-
207
-
208
-
209
-
210
-
211
-
212
-
213
-
214
-
215
-
216
-
217
-
218
-
219
-
220
-
221
-
222
-
223
-
224
-
225
-
226
-
227
-
228
-
229
-
230
-
231
-
232
-
233
-
234
-
235
-
236
-
 237
237 -
 238
238 -
 239
239 -
 240
240 -
 241
241 -
 242
242 -
 243
243 -
 244
244 -
 245
245 -
 246
246 -
 247
247 -
 248
248 -
 249
249 -
 250
250 -
 251
251 -
 252
252 -
 253
253 -
 254
254 -
 255
255 -
 256
256 -
 257
257 -
258
-
259
-
260
-
261
-
262
-
263
-
264
-
265
-
266
 |
 |

S
ELECTED
L
OAN
M
ATURITIES AND
I
NTEREST
S
ENSITIVITY
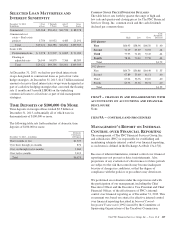
December 31, 2013
In millions
1 Year
or Less
1 Through
5 Years
After 5
Years
Gross
Loans
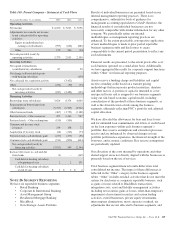
Commercial $23,368 $53,434 $11,576 $ 88,378
Commercial real
estate – Real estate
projects 5,754 10,952 4,485 21,191
Total $29,122 $64,386 $16,061 $109,569
Loans with:
Predetermined rate $ 2,978 $ 9,507 $ 8,695 $ 21,180
Floating or
adjustable rate 26,144 54,879 7,366 88,389
Total $29,122 $64,386 $16,061 $109,569
At December 31, 2013, we had no pay-fixed interest rate
swaps designated to commercial loans as part of fair value
hedge strategies. At December 31, 2013, $14.7 billion notional
amount of receive-fixed interest rate swaps were designated as
part of cash flow hedging strategies that converted the floating
rate (1 month and 3 month LIBOR) on the underlying
commercial loans to a fixed rate as part of risk management
strategies.
T
IME
D
EPOSITS OF
$100,000 O
R
M
ORE
Time deposits in foreign offices totaled $2.5 billion at
December 31, 2013, substantially all of which were in
denominations of $100,000 or more.
The following table sets forth maturities of domestic time
deposits of $100,000 or more:
December 31, 2013 – in millions
Domestic
Certificates
of Deposit
Three months or less $1,529
Over three through six months 876
Over six through twelve months 1,660
Over twelve months 2,410
Total $6,475
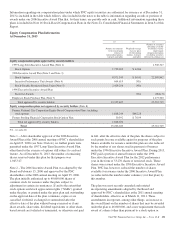
C
OMMON
S
TOCK
P
RICES
/D
IVIDENDS
D
ECLARED
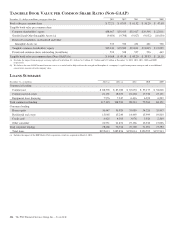
The table below sets forth by quarter the range of high and
low sale and quarter-end closing prices for The PNC Financial
Services Group, Inc. common stock and the cash dividends
declared per common share.
High Low Close
Cash
Dividends
Declared
2013 Quarter
First $66.93 $58.96 $66.50 $ .40
Second 74.19 63.69 72.92 .44
Third 77.93 71.48 72.45 .44
Fourth 78.36 70.63 77.58 .44
Total $1.72
2012 Quarter
First $64.79 $56.88 $64.49 $ .35
Second 67.89 55.60 61.11 .40
Third 67.04 56.76 63.10 .40
Fourth 65.73 53.36 58.31 .40
Total $1.55
ITEM
9–
CHANGES IN AND DISAGREEMENTS WITH
ACCOUNTANTS ON ACCOUNTING AND FINANCIAL
DISCLOSURE
None.
ITEM
9A –
CONTROLS AND PROCEDURES
M
ANAGEMENT
’
S
R
EPORT ON
I
NTERNAL
C
ONTROL OVER
F
INANCIAL
R
EPORTING
The management of The PNC Financial Services Group, Inc.
and subsidiaries (PNC) is responsible for establishing and
maintaining adequate internal control over financial reporting,
as such term is defined in the Exchange Act Rule 13a-15(f).
Because of inherent limitations, internal control over financial
reporting may not prevent or detect misstatements. Also,
projections of any evaluation of effectiveness to future periods
are subject to the risk that controls may become inadequate
because of changes in conditions, or that the degree of
compliance with the policies or procedures may deteriorate.
We performed an evaluation under the supervision and with
the participation of our management, including the Chief
Executive Officer and the Executive Vice President and Chief
Financial Officer, of the effectiveness of PNC’s internal
control over financial reporting as of December 31, 2013. This
assessment was based on criteria for effective internal control
over financial reporting described in Internal Control-
Integrated Framework (1992) issued by the Committee of
Sponsoring Organizations of the Treadway Commission.
The PNC Financial Services Group, Inc. – Form 10-K 229