PNC Bank 2013 Annual Report Download - page 69
Download and view the complete annual report
Please find page 69 of the 2013 PNC Bank annual report below. You can navigate through the pages in the report by either clicking on the pages listed below, or by using the keyword search tool below to find specific information within the annual report.-
 1
1 -
2
-
3
-
4
-
5
-
6
-
7
-
8
-
9
-
10
-
11
-
12
-
13
-
14
-
15
-
16
-
17
-
18
-
19
-
20
-
21
-
22
-
23
-
24
-
25
-
26
-
27
-
28
-
29
-
30
-
31
-
32
-
33
-
34
-
35
-
36
-
37
-
38
-
39
-
40
-
41
-
42
-
43
-
44
-
45
-
46
-
47
-
48
-
49
-
50
-
51
-
52
-
53
-
54
-
55
-
56
-
57
-
58
-
 59
59 -
 60
60 -
 61
61 -
 62
62 -
 63
63 -
 64
64 -
 65
65 -
 66
66 -
 67
67 -
 68
68 -
 69
69 -
 70
70 -
 71
71 -
 72
72 -
 73
73 -
 74
74 -
 75
75 -
 76
76 -
 77
77 -
 78
78 -
 79
79 -
80
-
81
-
82
-
83
-
84
-
85
-
86
-
87
-
88
-
89
-
90
-
91
-
92
-
93
-
94
-
95
-
96
-
97
-
98
-
99
-
100
-
101
-
102
-
103
-
104
-
105
-
106
-
107
-
108
-
109
-
110
-
111
-
112
-
113
-
114
-
115
-
116
-
117
-
118
-
119
-
120
-
121
-
122
-
123
-
124
-
125
-
126
-
127
-
128
-
129
-
130
-
131
-
132
-
133
-
134
-
135
-
136
-
137
-
138
-
139
-
140
-
141
-
142
-
143
-
144
-
145
-
146
-
147
-
148
-
149
-
150
-
151
-
152
-
153
-
154
-
155
-
156
-
157
-
158
-
159
-
160
-
161
-
162
-
163
-
164
-
165
-
166
-
167
-
168
-
169
-
170
-
171
-
172
-
173
-
174
-
175
-
176
-
177
-
178
-
179
-
180
-
181
-
182
-
183
-
184
-
185
-
186
-
187
-
188
-
189
-
190
-
191
-
192
-
193
-
194
-
195
-
196
-
197
-
198
-
199
-
200
-
201
-
202
-
203
-
204
-
205
-
206
-
207
-
208
-
209
-
210
-
211
-
212
-
213
-
214
-
215
-
216
-
217
-
218
-
219
-
220
-
221
-
222
-
223
-
224
-
225
-
226
-
227
-
228
-
229
-
230
-
231
-
232
-
233
-
234
-
235
-
236
-
237
-
238
-
239
-
240
-
241
-
242
-
243
-
244
-
245
-
246
-
247
-
248
-
249
-
250
-
251
-
252
-
253
-
254
-
255
-
256
-
257
-
258
-
259
-
260
-
261
-
262
-
263
-
264
-
265
-
266
 |
 |

R
ETAIL
B
ANKING
(Unaudited)
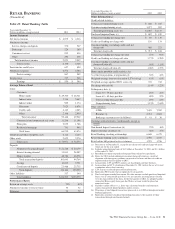
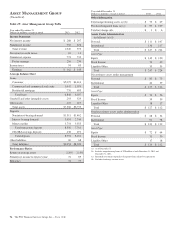
Table 23: Retail Banking Table
Year ended December 31
Dollars in millions, except as noted 2013 2012
Income Statement
Net interest income $ 4,079 $ 4,316
Noninterest income
Service charges on deposits 570 547
Brokerage 224 189
Consumer services 935 838
Other 292 438
Total noninterest income 2,021 2,012
Total revenue 6,100 6,328
Provision for credit losses 657 800
Noninterest expense 4,576 4,586
Pretax earnings 867 942
Income taxes 317 346
Earnings $ 550 $ 596
Average Balance Sheet
Loans
Consumer
Home equity $ 29,300 $ 28,321
Indirect auto 7,746 5,467
Indirect other 909 1,174
Education 7,923 8,878
Credit cards 4,142 4,063
Other 2,148 2,039
Total consumer 52,168 49,942
Commercial and commercial real estate 11,266 11,198
Floor plan 2,055 1,788
Residential mortgage 741 946
Total loans 66,230 63,874
Goodwill and other intangible assets 6,116 6,123
Other assets 2,625 2,576
Total assets $ 74,971 $ 72,573
Deposits
Noninterest-bearing demand $ 21,248 $ 20,179
Interest-bearing demand 31,811 28,007
Money market 48,784 46,578
Total transaction deposits 101,843 94,764
Savings 10,835 9,751
Certificates of deposit 21,488 25,715
Total deposits 134,166 130,230
Other liabilities 337 340
Total liabilities $134,503 $130,570
Performance Ratios
Return on average assets .73% .82%
Noninterest income to total revenue 33 32
Efficiency 75 72
Year ended December 31
Dollars in millions, except as noted 2013 2012
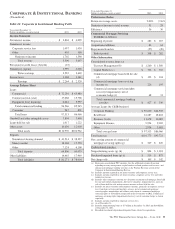
Other Information (a)
Credit-related statistics:
Commercial nonperforming assets $ 208 $ 245
Consumer nonperforming assets 1,077 902
Total nonperforming assets (b) $1,285 $1,147
Purchased impaired loans (c) $ 692 $ 819
Commercial lending net charge-offs $ 89 $ 119
Credit card lending net charge-offs 156 174
Consumer lending (excluding credit card) net
charge-offs 468 521
Total net charge-offs $ 713 $ 814
Commercial lending net charge-off ratio .67% .92%
Credit card lending net charge-off ratio 3.77% 4.28%
Consumer lending (excluding credit card) net
charge-off ratio (d) .96% 1.11%
Total net charge-off ratio (d) 1.08% 1.27%
Home equity portfolio credit statistics: (e)
% of first lien positions at origination (f) 52% 42%
Weighted-average loan-to-value ratios (LTVs) (f) (g) 81% 81%
Weighted-average updated FICO scores (h) 745 742
Net charge-off ratio (d) 1.14% 1.22%
Delinquency data: (i)
Loans 30 – 59 days past due .20% .42%
Loans 60 – 89 days past due .09% .22%
Total accruing loans past due .29% .64%
Nonperforming loans 3.15% 2.64%
Other statistics:
ATMs 7,445 7,282
Branches (j) 2,714 2,881
Brokerage account assets (in billions) $ 41 $ 38
Customer-related statistics: (in thousands, except as
noted)
Non-branch deposit transactions (k) 25% 16%
Digital consumer customers (l) 38% 35%
Retail Banking checking relationships 6,648 6,475
Retail online banking active customers 4,592 4,227
Retail online bill payment active customers 1,293 1,236
(a) Presented as of December 31, except for net charge-offs and net charge-off ratios,
which are for the year ended.
(b) Includes nonperforming loans of $1.2 billion at December 31, 2013 and $1.1 billion
at December 31, 2012.
(c) Recorded investment of purchased impaired loans related to acquisitions.
(d) Ratios for 2013 include additional consumer charge-offs taken as a result of
alignment with interagency guidance on practices for loans and lines of credit we
implemented in the first quarter of 2013.
(e) Lien position, LTV and FICO statistics are based upon customer balances.
(f) Lien position and LTV calculation at December 31, 2013 reflect the use of revised
assumptions where data is missing.
(g) LTV statistics are based upon current information.
(h) Represents FICO scores that are updated at least quarterly.
(i) Data based upon recorded investment. Past due amounts exclude purchased impaired
loans, even if contractually past due as we are currently accreting interest income
over the expected life of the loans. In the first quarter of 2012, we adopted a policy
stating that Home equity loans past due 90 days or more would be placed on
nonaccrual status.
(j) Excludes satellite offices (e.g., drive-ups, electronic branches and retirement
centers) that provide limited products and/or services.
(k) Percentage of total deposit transactions processed at an ATM or through our mobile
banking application.
(l) Represents consumer checking relationships that process the majority of their
transactions through non-branch channels.
The PNC Financial Services Group, Inc. – Form 10-K 51