PNC Bank 2013 Annual Report Download - page 94
Download and view the complete annual report
Please find page 94 of the 2013 PNC Bank annual report below. You can navigate through the pages in the report by either clicking on the pages listed below, or by using the keyword search tool below to find specific information within the annual report.-
 1
1 -
2
-
3
-
4
-
5
-
6
-
7
-
8
-
9
-
10
-
11
-
12
-
13
-
14
-
15
-
16
-
17
-
18
-
19
-
20
-
21
-
22
-
23
-
24
-
25
-
26
-
27
-
28
-
29
-
30
-
31
-
32
-
33
-
34
-
35
-
36
-
37
-
38
-
39
-
40
-
41
-
42
-
43
-
44
-
45
-
46
-
47
-
48
-
49
-
50
-
51
-
52
-
53
-
54
-
55
-
56
-
57
-
58
-
59
-
60
-
61
-
62
-
63
-
64
-
65
-
66
-
67
-
68
-
69
-
70
-
71
-
72
-
73
-
74
-
75
-
76
-
77
-
78
-
79
-
80
-
81
-
82
-
83
-
 84
84 -
 85
85 -
 86
86 -
 87
87 -
 88
88 -
 89
89 -
 90
90 -
 91
91 -
 92
92 -
 93
93 -
 94
94 -
 95
95 -
 96
96 -
 97
97 -
 98
98 -
 99
99 -
 100
100 -
 101
101 -
 102
102 -
 103
103 -
 104
104 -
105
-
106
-
107
-
108
-
109
-
110
-
111
-
112
-
113
-
114
-
115
-
116
-
117
-
118
-
119
-
120
-
121
-
122
-
123
-
124
-
125
-
126
-
127
-
128
-
129
-
130
-
131
-
132
-
133
-
134
-
135
-
136
-
137
-
138
-
139
-
140
-
141
-
142
-
143
-
144
-
145
-
146
-
147
-
148
-
149
-
150
-
151
-
152
-
153
-
154
-
155
-
156
-
157
-
158
-
159
-
160
-
161
-
162
-
163
-
164
-
165
-
166
-
167
-
168
-
169
-
170
-
171
-
172
-
173
-
174
-
175
-
176
-
177
-
178
-
179
-
180
-
181
-
182
-
183
-
184
-
185
-
186
-
187
-
188
-
189
-
190
-
191
-
192
-
193
-
194
-
195
-
196
-
197
-
198
-
199
-
200
-
201
-
202
-
203
-
204
-
205
-
206
-
207
-
208
-
209
-
210
-
211
-
212
-
213
-
214
-
215
-
216
-
217
-
218
-
219
-
220
-
221
-
222
-
223
-
224
-
225
-
226
-
227
-
228
-
229
-
230
-
231
-
232
-
233
-
234
-
235
-
236
-
237
-
238
-
239
-
240
-
241
-
242
-
243
-
244
-
245
-
246
-
247
-
248
-
249
-
250
-
251
-
252
-
253
-
254
-
255
-
256
-
257
-
258
-
259
-
260
-
261
-
262
-
263
-
264
-
265
-
266
 |
 |
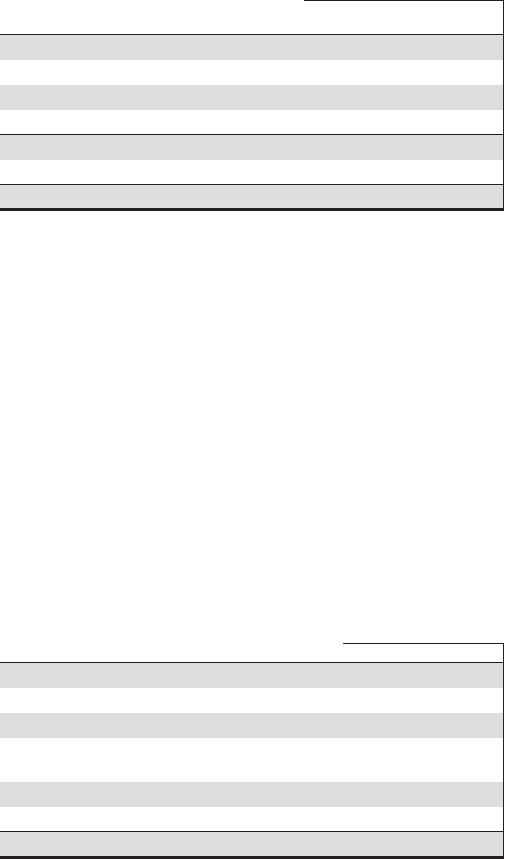
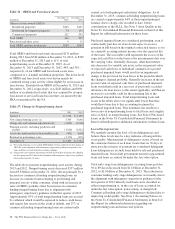
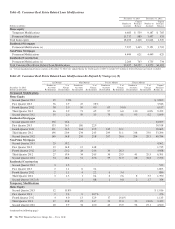
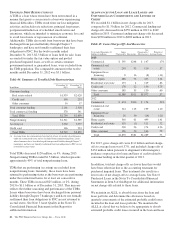
Table 36 : OREO and Foreclosed Assets
In millions
December 31
2013
December 31
2012
Other real estate owned (OREO):
Residential properties $164 $167
Residential development properties 74 135
Commercial properties 122 205
Total OREO 360 507
Foreclosed and other assets 9 33
Total OREO and foreclosed assets $369 $540
Total OREO and foreclosed assets decreased $171 million
during 2013 from $540 million at December 31, 2012, to $369
million at December 31, 2013 and is 11% of total
nonperforming assets at December 31, 2013. As of
December 31, 2013 and December 31, 2012, 44% and 31%,
respectively, of our OREO and foreclosed assets were
comprised of 1-4 family residential properties. The lower level
of OREO and foreclosed assets was driven mainly by
continued strong sales activity offset slightly by an increase in
foreclosures. Excluded from OREO at December 31, 2013 and
December 31, 2012, respectively, was $245 million and $380
million of residential real estate that was acquired by us upon
foreclosure of serviced loans because they are insured by the
FHA or guaranteed by the VA.
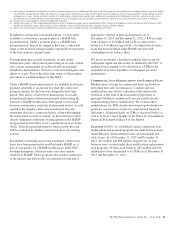
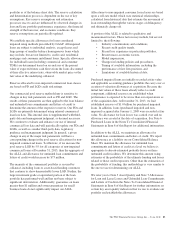
Table 37: Change in Nonperforming Assets
In millions 2013 2012
January 1 $ 3,794 $ 4,156
New nonperforming assets (a) 3,343 3,648
Charge-offs and valuation adjustments (b) (1,002) (1,218)
Principal activity, including paydowns and
payoffs (1,016) (1,812)
Asset sales and transfers to loans held for sale (492) (610)
Returned to performing status (1,170) (370)
December 31 $ 3,457 $ 3,794
(a) New nonperforming assets include $560 million of loans added in the first quarter of
2013 due to the alignment with interagency supervisory guidance on practices for
loans and lines of credit related to consumer lending.
(b) Charge-offs and valuation adjustments include $134 million of charge-offs added in
the first quarter of 2013 due to the alignment with interagency supervisory guidance
discussed in footnote (a) above.
The table above presents nonperforming asset activity during
2013 and 2012. Nonperforming assets decreased $337 million
from $3.8 billion at December 31, 2012, driven primarily by a
decrease in commercial lending nonperforming loans, an
increase in consumer loans returning to performing and
principal activity within consumer, along with an increase in
sales of OREO, partially offset by increases in consumer
lending nonperforming loans due to alignment with
interagency supervisory guidance in the first quarter of 2013.
Approximately 87% of total nonperforming loans are secured
by collateral which would be expected to reduce credit losses
and require less reserve in the event of default, and 27% of
commercial lending nonperforming loans are contractually
current as to both principal and interest obligations. As of
December 31, 2013, commercial lending nonperforming loans
are carried at approximately 64% of their unpaid principal
balance, due to charge-offs recorded to date, before
consideration of the ALLL. See Note 5 Asset Quality in the
Notes To Consolidated Financial Statements in Item 8 of this
Report for additional information on these loans.
Purchased impaired loans are considered performing, even if
contractually past due (or if we do not expect to receive
payment in full based on the original contractual terms), as we
are currently accreting interest income over the expected life
of the loans. The accretable yield represents the excess of the
expected cash flows on the loans at the measurement date over
the carrying value. Generally decreases, other than interest
rate decreases for variable rate notes, in the net present value
of expected cash flows of individual commercial or pooled
purchased impaired loans would result in an impairment
charge to the provision for loan losses in the period in which
the change is deemed probable. Generally increases in the net
present value of expected cash flows of purchased impaired
loans would first result in a recovery of previously recorded
allowance for loan losses, to the extent applicable, and then an
increase to accretable yield for the remaining life of the
purchased impaired loans. Total nonperforming loans and
assets in the tables above are significantly lower than they
would have been due to this accounting treatment for
purchased impaired loans. This treatment also results in a
lower ratio of nonperforming loans to total loans and a higher
ratio of ALLL to nonperforming loans. See Note 6 Purchased
Loans in the Notes To Consolidated Financial Statements in
Item 8 of this Report for additional information on these loans.
L
OAN
D
ELINQUENCIES
We regularly monitor the level of loan delinquencies and
believe these levels may be a key indicator of loan portfolio
asset quality. Measurement of delinquency status is based on
the contractual terms of each loan. Loans that are 30 days or
more past due in terms of payment are considered delinquent.
Loan delinquencies exclude loans held for sale and purchased
impaired loans, but include government insured or guaranteed
loans and loans accounted for under the fair value option.
Total early stage loan delinquencies (accruing loans past due
30 to 89 days) decreased from $1.4 billion at December 31,
2012, to $1.0 billion at December 31, 2013. The reduction in
consumer lending early stage delinquencies was mainly due to
the alignment with interagency supervisory guidance in the
first quarter of 2013 whereby such loans were classified as
either nonperforming or, in the case of loans accounted for
under the fair value option, nonaccruing, or charged off.
Commercial lending early stage delinquencies declined due to
improving credit quality. See Note 1 Accounting Policies in
the Notes To Consolidated Financial Statements in Item 8 of
this Report for additional information regarding our
nonperforming loan and nonaccrual policies.
76 The PNC Financial Services Group, Inc. – Form 10-K