PNC Bank 2013 Annual Report Download - page 73
Download and view the complete annual report
Please find page 73 of the 2013 PNC Bank annual report below. You can navigate through the pages in the report by either clicking on the pages listed below, or by using the keyword search tool below to find specific information within the annual report.-
 1
1 -
2
-
3
-
4
-
5
-
6
-
7
-
8
-
9
-
10
-
11
-
12
-
13
-
14
-
15
-
16
-
17
-
18
-
19
-
20
-
21
-
22
-
23
-
24
-
25
-
26
-
27
-
28
-
29
-
30
-
31
-
32
-
33
-
34
-
35
-
36
-
37
-
38
-
39
-
40
-
41
-
42
-
43
-
44
-
45
-
46
-
47
-
48
-
49
-
50
-
51
-
52
-
53
-
54
-
55
-
56
-
57
-
58
-
59
-
60
-
61
-
62
-
 63
63 -
 64
64 -
 65
65 -
 66
66 -
 67
67 -
 68
68 -
 69
69 -
 70
70 -
 71
71 -
 72
72 -
 73
73 -
 74
74 -
 75
75 -
 76
76 -
 77
77 -
 78
78 -
 79
79 -
 80
80 -
 81
81 -
 82
82 -
 83
83 -
84
-
85
-
86
-
87
-
88
-
89
-
90
-
91
-
92
-
93
-
94
-
95
-
96
-
97
-
98
-
99
-
100
-
101
-
102
-
103
-
104
-
105
-
106
-
107
-
108
-
109
-
110
-
111
-
112
-
113
-
114
-
115
-
116
-
117
-
118
-
119
-
120
-
121
-
122
-
123
-
124
-
125
-
126
-
127
-
128
-
129
-
130
-
131
-
132
-
133
-
134
-
135
-
136
-
137
-
138
-
139
-
140
-
141
-
142
-
143
-
144
-
145
-
146
-
147
-
148
-
149
-
150
-
151
-
152
-
153
-
154
-
155
-
156
-
157
-
158
-
159
-
160
-
161
-
162
-
163
-
164
-
165
-
166
-
167
-
168
-
169
-
170
-
171
-
172
-
173
-
174
-
175
-
176
-
177
-
178
-
179
-
180
-
181
-
182
-
183
-
184
-
185
-
186
-
187
-
188
-
189
-
190
-
191
-
192
-
193
-
194
-
195
-
196
-
197
-
198
-
199
-
200
-
201
-
202
-
203
-
204
-
205
-
206
-
207
-
208
-
209
-
210
-
211
-
212
-
213
-
214
-
215
-
216
-
217
-
218
-
219
-
220
-
221
-
222
-
223
-
224
-
225
-
226
-
227
-
228
-
229
-
230
-
231
-
232
-
233
-
234
-
235
-
236
-
237
-
238
-
239
-
240
-
241
-
242
-
243
-
244
-
245
-
246
-
247
-
248
-
249
-
250
-
251
-
252
-
253
-
254
-
255
-
256
-
257
-
258
-
259
-
260
-
261
-
262
-
263
-
264
-
265
-
266
 |
 |
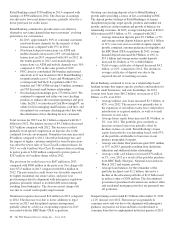
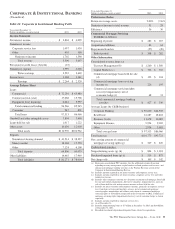
• PNC Business Credit was one of the top three asset-
based lenders in the country, as of year-end 2013,
with increasing market share according to the
Commercial Finance Association. The loan portfolio
is relatively high yielding, with acceptable risk as the
loans are mainly secured by short-term assets.
Average loans increased $1.6 billion, or 16%, in
2013 compared with 2012 due to customers seeking
stable lending sources, loan usage rates and market
share expansion.
• PNC Equipment Finance was the 4th largest bank-
affiliated leasing company with over $11 billion in
equipment finance assets as of December 31, 2013.
Average equipment finance assets for the leasing
company in 2013 were $11.4 billion, an increase of
$1.1 billion or 11% compared with 2012.
Average deposits were $66.8 billion in 2013, an increase of
$6.8 billion, or 11%, compared with 2012 as a result of
business growth and inflows into noninterest-bearing and
money market deposits.
The commercial mortgage servicing portfolio was $308 billion
at December 31, 2013 compared with $282 billion at
December 31, 2012 as servicing additions exceeded portfolio
run-off.
P
RODUCT
R
EVENUE
In addition to credit and deposit products for commercial
customers, Corporate & Institutional Banking offers other
services, including treasury management, capital markets-
related products and services, and commercial mortgage
banking activities, for customers of all our business segments.
On a consolidated basis, the revenue from these other services
is included in net interest income, corporate service fees and
other noninterest income. From a segment perspective, the
majority of the revenue and expense related to these services
is reflected in the Corporate & Institutional Banking segment
results and the remainder is reflected in the results of other
businesses. The Other Information section in Table 24 in this
Business Segments Review section includes the consolidated
revenue to PNC for these services. A discussion of the
consolidated revenue from these services follows.
Treasury management revenue comprised of fees and net
interest income from customer deposit balances totaled $1.3
billion for 2013 compared with $1.4 billion for 2012. Lower
spreads on deposits drove the decline in revenue in 2013
compared with 2012. Growth in deposit balances, and
products such as liquidity management products and payables
was strong.
Capital markets revenue includes merger and acquisition
advisory fees, loan syndications, derivatives, foreign
exchange, asset-backed finance revenue and fixed income
activities. Revenue from capital markets-related products and
services totaled $722 million in 2013 compared with $710
million in 2012. The increase was driven by the impact of
higher market interest rates on credit valuations for customer-
related derivatives activities, mostly offset by lower merger
and acquisition advisory fees and customer-driven derivatives
and fixed income revenue.
Commercial mortgage banking activities include revenue
derived from commercial mortgage servicing (including net
interest income and noninterest income from loan servicing
and ancillary services, net of commercial mortgage servicing
rights amortization, and commercial mortgage servicing rights
valuations net of economic hedge), and revenue derived from
commercial mortgage loans intended for sale and related
hedges (including loan origination fees, net interest income,
valuation adjustments and gains or losses on sales).
Commercial mortgage banking activities resulted in revenue
of $427 million in 2013 compared with $330 million in 2012.
The increase was mainly due to higher net revenue from
commercial mortgage servicing, primarily driven by the
impact of higher market interest rates on net commercial
mortgage servicing rights valuations, and higher loan
originations. The commercial mortgage banking activities for
2012 included a direct write-down of commercial mortgage
servicing rights of $24 million.
The PNC Financial Services Group, Inc. – Form 10-K 55