PNC Bank 2013 Annual Report Download - page 194
Download and view the complete annual report
Please find page 194 of the 2013 PNC Bank annual report below. You can navigate through the pages in the report by either clicking on the pages listed below, or by using the keyword search tool below to find specific information within the annual report.-
 1
1 -
2
-
3
-
4
-
5
-
6
-
7
-
8
-
9
-
10
-
11
-
12
-
13
-
14
-
15
-
16
-
17
-
18
-
19
-
20
-
21
-
22
-
23
-
24
-
25
-
26
-
27
-
28
-
29
-
30
-
31
-
32
-
33
-
34
-
35
-
36
-
37
-
38
-
39
-
40
-
41
-
42
-
43
-
44
-
45
-
46
-
47
-
48
-
49
-
50
-
51
-
52
-
53
-
54
-
55
-
56
-
57
-
58
-
59
-
60
-
61
-
62
-
63
-
64
-
65
-
66
-
67
-
68
-
69
-
70
-
71
-
72
-
73
-
74
-
75
-
76
-
77
-
78
-
79
-
80
-
81
-
82
-
83
-
84
-
85
-
86
-
87
-
88
-
89
-
90
-
91
-
92
-
93
-
94
-
95
-
96
-
97
-
98
-
99
-
100
-
101
-
102
-
103
-
104
-
105
-
106
-
107
-
108
-
109
-
110
-
111
-
112
-
113
-
114
-
115
-
116
-
117
-
118
-
119
-
120
-
121
-
122
-
123
-
124
-
125
-
126
-
127
-
128
-
129
-
130
-
131
-
132
-
133
-
134
-
135
-
136
-
137
-
138
-
139
-
140
-
141
-
142
-
143
-
144
-
145
-
146
-
147
-
148
-
149
-
150
-
151
-
152
-
153
-
154
-
155
-
156
-
157
-
158
-
159
-
160
-
161
-
162
-
163
-
164
-
165
-
166
-
167
-
168
-
169
-
170
-
171
-
172
-
173
-
174
-
175
-
176
-
177
-
178
-
179
-
180
-
181
-
182
-
183
-
 184
184 -
 185
185 -
 186
186 -
 187
187 -
 188
188 -
 189
189 -
 190
190 -
 191
191 -
 192
192 -
 193
193 -
 194
194 -
 195
195 -
 196
196 -
 197
197 -
 198
198 -
 199
199 -
 200
200 -
 201
201 -
 202
202 -
 203
203 -
 204
204 -
205
-
206
-
207
-
208
-
209
-
210
-
211
-
212
-
213
-
214
-
215
-
216
-
217
-
218
-
219
-
220
-
221
-
222
-
223
-
224
-
225
-
226
-
227
-
228
-
229
-
230
-
231
-
232
-
233
-
234
-
235
-
236
-
237
-
238
-
239
-
240
-
241
-
242
-
243
-
244
-
245
-
246
-
247
-
248
-
249
-
250
-
251
-
252
-
253
-
254
-
255
-
256
-
257
-
258
-
259
-
260
-
261
-
262
-
263
-
264
-
265
-
266
 |
 |

N
OTE
12 T
IME
D
EPOSITS
The aggregate amount of time deposits with a denomination of
$100,000 or more was $9.0 billion at December 31, 2013 and
$9.3 billion at December 31, 2012.
Total time deposits of $23.5 billion at December 31, 2013
have future contractual maturities, including related purchase
accounting adjustments, as follows:
• 2014: $16.4 billion,
• 2015: $2.5 billion,
• 2016: $1.3 billion,
• 2017: $0.4 billion,
• 2018: $0.3 billion, and
• 2019 and thereafter: $2.6 billion.
N
OTE
13 B
ORROWED
F
UNDS
The following shows the carrying value of total borrowed
funds of $46.1 billion at December 31, 2013 (including
primarily valuation adjustments, non-cash related accounting
adjustments and unamortized original issuance discounts) by
remaining contractual maturity:
• 2014: $18.5 billion,
• 2015: $5.8 billion,
• 2016: $8.0 billion,
• 2017: $4.5 billion,
• 2018: $.6 billion, and
• 2019 and thereafter: $8.7 billion.
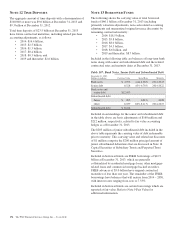
Included in the following table are balances of long-term bank
notes along with senior and subordinated debt and the related
contractual rates and maturity dates at December 31, 2013.
Table 107: Bank Notes, Senior Debt and Subordinated Debt
December 31, 2013
Dollars in millions Carrying Value Stated Rate Maturity
Bank notes $ 4,075 zero-4.66% 2014-2043
Senior debt 8,528 .45%-6.70% 2014-2022
Bank notes and
senior debt $12,603
Subordinated debt
Junior $ 205 0.81% 2028
Other 8,039 .60%-8.11% 2014-2025
Subordinated debt $ 8,244
Included in outstandings for the senior and subordinated debt
in the table above are basis adjustments of $160 million and
$212 million, respectively, related to fair value accounting
hedges as of December 31, 2013.
The $205 million of junior subordinated debt included in the
above table represents the carrying value of debt redeemable
prior to maturity. This carrying value and related net discounts
of $1 million comprise the $206 million principal amount of
junior subordinated debentures that are discussed in Note 14
Capital Securities of Subsidiary Trusts and Perpetual Trust
Securities.
Included in borrowed funds are FHLB borrowings of $12.9
billion at December 31, 2013, which are generally
collateralized by residential mortgage loans, other mortgage-
related loans and commercial mortgage-backed securities.
FHLB advances of $5.0 billion have original contractual
maturities of less than one year. The remainder of the FHLB
borrowings have balances that will mature from 2014 – 2030,
with interest rates ranging from zero to 7.33%.
Included in borrowed funds are certain borrowings which are
reported at fair value. Refer to Note 9 Fair Value for
additional information.
176 The PNC Financial Services Group, Inc. – Form 10-K