PNC Bank 2013 Annual Report Download - page 57
Download and view the complete annual report
Please find page 57 of the 2013 PNC Bank annual report below. You can navigate through the pages in the report by either clicking on the pages listed below, or by using the keyword search tool below to find specific information within the annual report.-
 1
1 -
2
-
3
-
4
-
5
-
6
-
7
-
8
-
9
-
10
-
11
-
12
-
13
-
14
-
15
-
16
-
17
-
18
-
19
-
20
-
21
-
22
-
23
-
24
-
25
-
26
-
27
-
28
-
29
-
30
-
31
-
32
-
33
-
34
-
35
-
36
-
37
-
38
-
39
-
40
-
41
-
42
-
43
-
44
-
45
-
46
-
 47
47 -
 48
48 -
 49
49 -
 50
50 -
 51
51 -
 52
52 -
 53
53 -
 54
54 -
 55
55 -
 56
56 -
 57
57 -
 58
58 -
 59
59 -
 60
60 -
 61
61 -
 62
62 -
 63
63 -
 64
64 -
 65
65 -
 66
66 -
 67
67 -
68
-
69
-
70
-
71
-
72
-
73
-
74
-
75
-
76
-
77
-
78
-
79
-
80
-
81
-
82
-
83
-
84
-
85
-
86
-
87
-
88
-
89
-
90
-
91
-
92
-
93
-
94
-
95
-
96
-
97
-
98
-
99
-
100
-
101
-
102
-
103
-
104
-
105
-
106
-
107
-
108
-
109
-
110
-
111
-
112
-
113
-
114
-
115
-
116
-
117
-
118
-
119
-
120
-
121
-
122
-
123
-
124
-
125
-
126
-
127
-
128
-
129
-
130
-
131
-
132
-
133
-
134
-
135
-
136
-
137
-
138
-
139
-
140
-
141
-
142
-
143
-
144
-
145
-
146
-
147
-
148
-
149
-
150
-
151
-
152
-
153
-
154
-
155
-
156
-
157
-
158
-
159
-
160
-
161
-
162
-
163
-
164
-
165
-
166
-
167
-
168
-
169
-
170
-
171
-
172
-
173
-
174
-
175
-
176
-
177
-
178
-
179
-
180
-
181
-
182
-
183
-
184
-
185
-
186
-
187
-
188
-
189
-
190
-
191
-
192
-
193
-
194
-
195
-
196
-
197
-
198
-
199
-
200
-
201
-
202
-
203
-
204
-
205
-
206
-
207
-
208
-
209
-
210
-
211
-
212
-
213
-
214
-
215
-
216
-
217
-
218
-
219
-
220
-
221
-
222
-
223
-
224
-
225
-
226
-
227
-
228
-
229
-
230
-
231
-
232
-
233
-
234
-
235
-
236
-
237
-
238
-
239
-
240
-
241
-
242
-
243
-
244
-
245
-
246
-
247
-
248
-
249
-
250
-
251
-
252
-
253
-
254
-
255
-
256
-
257
-
258
-
259
-
260
-
261
-
262
-
263
-
264
-
265
-
266
 |
 |

L
OANS
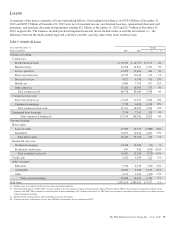
A summary of the major categories of loans outstanding follows. Outstanding loan balances of $195.6 billion at December 31,
2013 and $185.9 billion at December 31, 2012 were net of unearned income, net deferred loan fees, unamortized discounts and
premiums, and purchase discounts and premiums totaling $2.1 billion at December 31, 2013 and $2.7 billion at December 31,
2012, respectively. The balances include purchased impaired loans but do not include future accretable net interest (i.e., the
difference between the undiscounted expected cash flows and the carrying value of the loan) on those loans.
Table 7: Details Of Loans
Year ended December 31 Change
Dollars in millions 2013 2012 $ %
Commercial lending
Commercial
Retail/wholesale trade $ 15,530 $ 14,353 $ 1,177 8%
Manufacturing 16,208 14,841 1,367 9%
Service providers 13,052 12,606 446 4%
Real estate related (a) 10,729 10,616 113 1%
Financial services 4,927 4,356 571 13%
Health care 8,690 7,763 927 12%
Other industries 19,242 18,505 737 4%
Total commercial (b) 88,378 83,040 5,338 6%
Commercial real estate
Real estate projects (c) 13,613 12,347 1,266 10%
Commercial mortgage 7,578 6,308 1,270 20%
Total commercial real estate 21,191 18,655 2,536 14%
Equipment lease financing 7,576 7,247 329 5%
Total commercial lending (d) 117,145 108,942 8,203 8%
Consumer lending
Home equity
Lines of credit 21,696 23,576 (1,880) (8)%
Installment 14,751 12,344 2,407 19%
Total home equity 36,447 35,920 527 1%
Residential real estate
Residential mortgage 14,418 14,430 (12) –%
Residential construction 647 810 (163) (20)%
Total residential real estate 15,065 15,240 (175) (1)%
Credit card 4,425 4,303 122 3 %
Other consumer
Education 7,534 8,238 (704) (9)%
Automobile 10,827 8,708 2,119 24 %
Other 4,170 4,505 (335) (7)%
Total consumer lending 78,468 76,914 1,554 2 %
Total loans $195,613 $185,856 $ 9,757 5 %
(a) Includes loans to customers in the real estate and construction industries.
(b) During the third quarter of 2013, PNC revised its policy to classify commercial loans initiated through a Special Purpose Entity (SPE) to be reported based upon the industry of the
sponsor of the SPE. This resulted in a reclassification of loans amounting to $4.7 billion at December 31, 2012 that were previously classified as Financial Services to other categories
within Commercial Lending.
(c) Includes both construction loans and intermediate financing for projects.
(d) Construction loans with interest reserves and A/B Note restructurings are not significant to PNC.
The PNC Financial Services Group, Inc. – Form 10-K 39