PNC Bank 2013 Annual Report Download - page 182
Download and view the complete annual report
Please find page 182 of the 2013 PNC Bank annual report below. You can navigate through the pages in the report by either clicking on the pages listed below, or by using the keyword search tool below to find specific information within the annual report.-
 1
1 -
2
-
3
-
4
-
5
-
6
-
7
-
8
-
9
-
10
-
11
-
12
-
13
-
14
-
15
-
16
-
17
-
18
-
19
-
20
-
21
-
22
-
23
-
24
-
25
-
26
-
27
-
28
-
29
-
30
-
31
-
32
-
33
-
34
-
35
-
36
-
37
-
38
-
39
-
40
-
41
-
42
-
43
-
44
-
45
-
46
-
47
-
48
-
49
-
50
-
51
-
52
-
53
-
54
-
55
-
56
-
57
-
58
-
59
-
60
-
61
-
62
-
63
-
64
-
65
-
66
-
67
-
68
-
69
-
70
-
71
-
72
-
73
-
74
-
75
-
76
-
77
-
78
-
79
-
80
-
81
-
82
-
83
-
84
-
85
-
86
-
87
-
88
-
89
-
90
-
91
-
92
-
93
-
94
-
95
-
96
-
97
-
98
-
99
-
100
-
101
-
102
-
103
-
104
-
105
-
106
-
107
-
108
-
109
-
110
-
111
-
112
-
113
-
114
-
115
-
116
-
117
-
118
-
119
-
120
-
121
-
122
-
123
-
124
-
125
-
126
-
127
-
128
-
129
-
130
-
131
-
132
-
133
-
134
-
135
-
136
-
137
-
138
-
139
-
140
-
141
-
142
-
143
-
144
-
145
-
146
-
147
-
148
-
149
-
150
-
151
-
152
-
153
-
154
-
155
-
156
-
157
-
158
-
159
-
160
-
161
-
162
-
163
-
164
-
165
-
166
-
167
-
168
-
169
-
170
-
171
-
 172
172 -
 173
173 -
 174
174 -
 175
175 -
 176
176 -
 177
177 -
 178
178 -
 179
179 -
 180
180 -
 181
181 -
 182
182 -
 183
183 -
 184
184 -
 185
185 -
 186
186 -
 187
187 -
 188
188 -
 189
189 -
 190
190 -
 191
191 -
 192
192 -
193
-
194
-
195
-
196
-
197
-
198
-
199
-
200
-
201
-
202
-
203
-
204
-
205
-
206
-
207
-
208
-
209
-
210
-
211
-
212
-
213
-
214
-
215
-
216
-
217
-
218
-
219
-
220
-
221
-
222
-
223
-
224
-
225
-
226
-
227
-
228
-
229
-
230
-
231
-
232
-
233
-
234
-
235
-
236
-
237
-
238
-
239
-
240
-
241
-
242
-
243
-
244
-
245
-
246
-
247
-
248
-
249
-
250
-
251
-
252
-
253
-
254
-
255
-
256
-
257
-
258
-
259
-
260
-
261
-
262
-
263
-
264
-
265
-
266
 |
 |

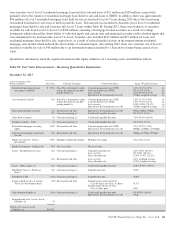
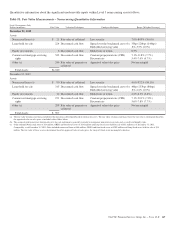
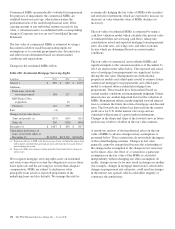
December 31, 2012
Level 3 Instruments Only
Dollars in millions Fair Value Valuation Techniques Unobservable Inputs Range (Weighted Average)
Residential mortgage-backed
non-agency securities
$ 6,107 Priced by a third-party vendor
using a discounted cash flow
pricing model (a)
Constant prepayment rate (CPR)
Constant default rate (CDR)
Loss severity
Spread over the benchmark curve (b)
1.0%-30.0% (5.0%)
0%-24.0% (7.0%)
10.0%-95.0% (52.0%)
315bps weighted average
(a)
(a)
(a)
(a)
Asset-backed securities 708 Priced by a third-party vendor
using a discounted cash flow
pricing model (a)
Constant prepayment rate (CPR)
Constant default rate (CDR)
Loss severity
Spread over the benchmark curve (b)
1.0%-11.0% (3.0%)
1.0%-25.0% (9.0%)
10.0%-100% (70.0%)
511bps weighted average
(a)
(a)
(a)
(a)
State and municipal securities 130
209
Discounted cash flow
Consensus pricing (c)
Spread over the benchmark curve (b)
Credit and Liquidity discount
100bps-280bps (119bps)
0%-30.0% (8.0%)
Other debt securities 48 Consensus pricing (c) Credit and Liquidity discount 7.0%-95.0% (86.0%)
Residential mortgage loan
commitments
85 Discounted cash flow Probability of funding
Embedded servicing value
8.5%-99.0% (71.1%)
.5%-1.2% (.9%)
Trading securities – Debt 32 Consensus pricing (c) Credit and Liquidity discount 8.0%-20.0% (12.0%)
Residential mortgage loans held
for sale
27 Consensus pricing (c) Cumulative default rate
Loss severity
Gross discount rate
2.6%-100% (76.1%)
0%-92.7% (55.8%)
14.0%-15.3% (14.9%)
Residential mortgage servicing
rights
650 Discounted cash flow Constant prepayment rate (CPR)
Spread over the benchmark curve (b)
3.9%-57.3% (18.8%)
939bps-1,929bps (1,115bps)
Commercial mortgage loans held
for sale
772 Discounted cash flow Spread over the benchmark curve (b) 485bps-4,155bps (999bps)
Equity investments – Direct
investments
1,171 Multiple of adjusted earnings Multiple of earnings 4.5x-10.0x (7.1x)
Equity investments – Indirect (d) 642 Net asset value Net asset value
Loans – Residential real estate 127 Consensus pricing (c) Cumulative default rate
Loss severity
Gross discount rate
2.6%-100% (76.3%)
0%-99.4% (61.1%)
12.0%-12.5% (12.2%)
Loans – Home equity 7 Consensus pricing (c) Credit and Liquidity discount 37.0%-97.0% (65.0%)
BlackRock Series C Preferred
Stock
243 Consensus pricing (c) Liquidity discount 22.5%
BlackRock LTIP (243) Consensus pricing (c) Liquidity discount 22.5%
Other derivative contracts (72) Discounted cash flow Credit and Liquidity discount
Spread over the benchmark curve (b)
37.0%-99.0% (46.0%)
79bps
Swaps related to sales of certain
Visa Class B common shares
(43) Discounted cash flow Estimated conversion factor of
Class B shares into Class A shares
Estimated growth rate of Visa
Class A share price
41.5%
12.6%
Insignificant Level 3 assets, net of
liabilities (f) 12
Total Level 3 assets, net of
liabilities (g) $10,612
(a) Level 3 residential mortgage-backed non-agency and asset-backed securities with fair values as of December 31, 2013 totaling $4,672 million and $610 million, respectively, were
priced by a third-party vendor using a discounted cash flow pricing model that incorporates consensus pricing, where available. The comparable amounts as of December 31, 2012
were $5,363 million and $677 million, respectively. The significant unobservable inputs for these securities were provided by the third-party vendor and are disclosed in the table. Our
procedures to validate the prices provided by the third-party vendor related to these securities are discussed further in the Fair Value Measurement section of this Note 9. Certain Level
3 residential mortgage-backed non-agency and asset-backed securities with fair values as of December 31, 2013 of $686 million and $31 million, respectively, were valued using a
pricing source, such as a dealer quote or comparable security price, for which the significant unobservable inputs used to determine the price were not reasonably available. The
comparable amounts as of December 31, 2012 were $744 million and $31 million, respectively.
(b) The assumed yield spread over the benchmark curve for each instrument is generally intended to incorporate non-interest-rate risks such as credit and liquidity risks.
(c) Consensus pricing refers to fair value estimates that are generally internally developed using information such as dealer quotes or other third-party provided valuations or comparable
asset prices.
(d) The range on these indirect equity investments has not been disclosed since these investments are recorded at their net asset redemption values.
(e) Primarily includes a Non-agency securitization that PNC consolidated in the first quarter of 2013.
(f) Represents the aggregate amount of Level 3 assets and liabilities measured at fair value on a recurring basis that are individually and in the aggregate insignificant. The amount
includes certain financial derivative assets and liabilities and other assets. For the period ended December 31, 2013, the amount also includes residential mortgage loans held for sale.
For additional information, please see commercial mortgage loan commitment assets and liabilities, residential mortgage loan commitment assets, interest rate option assets and
liabilities and risk participation agreement assets and liabilities within the Financial Derivatives discussion, and the Residential Mortgage Loans Held for Sale and Other Assets and
Liabilities discussions included in this Note 9.
(g) Consisted of total Level 3 assets of $10,635 million and total Level 3 liabilities of $623 million as of December 31, 2013 and $10,988 million and $376 million as of December 31,
2012, respectively.
164 The PNC Financial Services Group, Inc. – Form 10-K