PNC Bank 2013 Annual Report Download - page 168
Download and view the complete annual report
Please find page 168 of the 2013 PNC Bank annual report below. You can navigate through the pages in the report by either clicking on the pages listed below, or by using the keyword search tool below to find specific information within the annual report.-
 1
1 -
2
-
3
-
4
-
5
-
6
-
7
-
8
-
9
-
10
-
11
-
12
-
13
-
14
-
15
-
16
-
17
-
18
-
19
-
20
-
21
-
22
-
23
-
24
-
25
-
26
-
27
-
28
-
29
-
30
-
31
-
32
-
33
-
34
-
35
-
36
-
37
-
38
-
39
-
40
-
41
-
42
-
43
-
44
-
45
-
46
-
47
-
48
-
49
-
50
-
51
-
52
-
53
-
54
-
55
-
56
-
57
-
58
-
59
-
60
-
61
-
62
-
63
-
64
-
65
-
66
-
67
-
68
-
69
-
70
-
71
-
72
-
73
-
74
-
75
-
76
-
77
-
78
-
79
-
80
-
81
-
82
-
83
-
84
-
85
-
86
-
87
-
88
-
89
-
90
-
91
-
92
-
93
-
94
-
95
-
96
-
97
-
98
-
99
-
100
-
101
-
102
-
103
-
104
-
105
-
106
-
107
-
108
-
109
-
110
-
111
-
112
-
113
-
114
-
115
-
116
-
117
-
118
-
119
-
120
-
121
-
122
-
123
-
124
-
125
-
126
-
127
-
128
-
129
-
130
-
131
-
132
-
133
-
134
-
135
-
136
-
137
-
138
-
139
-
140
-
141
-
142
-
143
-
144
-
145
-
146
-
147
-
148
-
149
-
150
-
151
-
152
-
153
-
154
-
155
-
156
-
157
-
 158
158 -
 159
159 -
 160
160 -
 161
161 -
 162
162 -
 163
163 -
 164
164 -
 165
165 -
 166
166 -
 167
167 -
 168
168 -
 169
169 -
 170
170 -
 171
171 -
 172
172 -
 173
173 -
 174
174 -
 175
175 -
 176
176 -
 177
177 -
 178
178 -
179
-
180
-
181
-
182
-
183
-
184
-
185
-
186
-
187
-
188
-
189
-
190
-
191
-
192
-
193
-
194
-
195
-
196
-
197
-
198
-
199
-
200
-
201
-
202
-
203
-
204
-
205
-
206
-
207
-
208
-
209
-
210
-
211
-
212
-
213
-
214
-
215
-
216
-
217
-
218
-
219
-
220
-
221
-
222
-
223
-
224
-
225
-
226
-
227
-
228
-
229
-
230
-
231
-
232
-
233
-
234
-
235
-
236
-
237
-
238
-
239
-
240
-
241
-
242
-
243
-
244
-
245
-
246
-
247
-
248
-
249
-
250
-
251
-
252
-
253
-
254
-
255
-
256
-
257
-
258
-
259
-
260
-
261
-
262
-
263
-
264
-
265
-
266
 |
 |

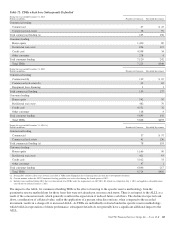
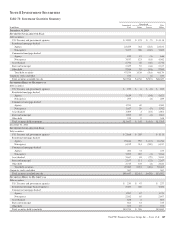
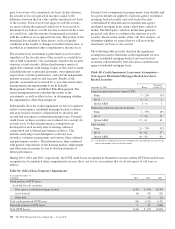
Table 78: Investment Securities Summary
(continued from previous page)
In millions
Amortized
Cost
Unrealized Fair
ValueGains Losses
December 31, 2011
S
ECURITIES
A
VAILABLE FOR
S
ALE
Debt securities
U.S. Treasury and government agencies $ 3,369 $ 348 $ 3,717
Residential mortgage-backed
Agency 26,081 772 $ (61) 26,792
Non-agency 6,673 152 (1,268) 5,557
Commercial mortgage-backed
Agency 1,101 39 1,140
Non-agency 2,693 80 (17) 2,756
Asset-backed 3,854 31 (216) 3,669
State and municipal 1,779 75 (47) 1,807
Other debt 2,691 83 (12) 2,762
Total debt securities 48,241 1,580 (1,621) 48,200
Corporate stocks and other 368 368
Total securities available for sale $48,609 $1,580 $(1,621) $48,568
S
ECURITIES
H
ELD TO
M
ATURITY
(a)
Debt securities
U.S. Treasury and government agencies $ 221 $ 40 $ 261
Residential mortgage-backed (agency) 4,761 131 $ (1) 4,891
Commercial mortgage-backed
Agency 1,332 50 1,382
Non-agency 3,467 108 (2) 3,573
Asset-backed 1,251 14 (3) 1,262
State and municipal 671 31 702
Other debt 363 16 379
Total securities held to maturity $12,066 $ 390 $ (6) $12,450
(a) Held to maturity securities transferred from available for sale are included in held to maturity at fair value at the time of transfer. The amortized cost of held to maturity securities
included net unrealized gains of $111 million, $142 million and $179 million at December 31, 2013, 2012 and 2011, respectively, related to securities transferred, which are offset in
Accumulated Other Comprehensive Income, net of tax.
The fair value of investment securities is impacted by interest
rates, credit spreads, market volatility and liquidity conditions.
Net unrealized gains and losses in the securities available for
sale portfolio are included in Shareholders’ equity as
Accumulated other comprehensive income or loss, net of tax,
unless credit-related. Securities held to maturity are carried at
amortized cost. At December 31, 2013, Accumulated other
comprehensive income included pretax gains of $69 million
from derivatives that hedged the purchase of investment
securities classified as held to maturity. The gains will be
accreted into interest income as an adjustment of yield on the
securities.
During 2013, we transferred securities with a fair value of
$1.9 billion from available for sale to held to maturity. The
securities transferred included $.9 billion of agency residential
mortgage-backed securities, $.3 billion of non-agency
residential mortgage backed securities, $.3 billion of non-
agency commercial mortgage-backed securities and $.4 billion
of state and municipal securities. The non-agency mortgage-
backed and state and municipal securities were predominately
AAA-equivalent. In addition, the non-agency residential
mortgage-backed securities were 2013 originations. We
changed our intent and committed to hold these high-quality
securities to maturity in order to reduce the impact of price
volatility on Accumulated other comprehensive income and
certain capital measures, taking into consideration market
conditions and changes to regulatory capital requirements
under Basel III capital standards. The securities were
reclassified at fair value at the time of transfer and the transfer
represented a non-cash transaction. Accumulated other
comprehensive income included net pretax unrealized gains of
$11 million at transfer, which are being accreted over the
remaining life of the related securities as an adjustment of
yield in a manner consistent with the amortization of the net
premium on the same transferred securities, resulting in no
impact on net income.
150 The PNC Financial Services Group, Inc. – Form 10-K