PNC Bank 2013 Annual Report Download - page 93
Download and view the complete annual report
Please find page 93 of the 2013 PNC Bank annual report below. You can navigate through the pages in the report by either clicking on the pages listed below, or by using the keyword search tool below to find specific information within the annual report.-
 1
1 -
2
-
3
-
4
-
5
-
6
-
7
-
8
-
9
-
10
-
11
-
12
-
13
-
14
-
15
-
16
-
17
-
18
-
19
-
20
-
21
-
22
-
23
-
24
-
25
-
26
-
27
-
28
-
29
-
30
-
31
-
32
-
33
-
34
-
35
-
36
-
37
-
38
-
39
-
40
-
41
-
42
-
43
-
44
-
45
-
46
-
47
-
48
-
49
-
50
-
51
-
52
-
53
-
54
-
55
-
56
-
57
-
58
-
59
-
60
-
61
-
62
-
63
-
64
-
65
-
66
-
67
-
68
-
69
-
70
-
71
-
72
-
73
-
74
-
75
-
76
-
77
-
78
-
79
-
80
-
81
-
82
-
 83
83 -
 84
84 -
 85
85 -
 86
86 -
 87
87 -
 88
88 -
 89
89 -
 90
90 -
 91
91 -
 92
92 -
 93
93 -
 94
94 -
 95
95 -
 96
96 -
 97
97 -
 98
98 -
 99
99 -
 100
100 -
 101
101 -
 102
102 -
 103
103 -
104
-
105
-
106
-
107
-
108
-
109
-
110
-
111
-
112
-
113
-
114
-
115
-
116
-
117
-
118
-
119
-
120
-
121
-
122
-
123
-
124
-
125
-
126
-
127
-
128
-
129
-
130
-
131
-
132
-
133
-
134
-
135
-
136
-
137
-
138
-
139
-
140
-
141
-
142
-
143
-
144
-
145
-
146
-
147
-
148
-
149
-
150
-
151
-
152
-
153
-
154
-
155
-
156
-
157
-
158
-
159
-
160
-
161
-
162
-
163
-
164
-
165
-
166
-
167
-
168
-
169
-
170
-
171
-
172
-
173
-
174
-
175
-
176
-
177
-
178
-
179
-
180
-
181
-
182
-
183
-
184
-
185
-
186
-
187
-
188
-
189
-
190
-
191
-
192
-
193
-
194
-
195
-
196
-
197
-
198
-
199
-
200
-
201
-
202
-
203
-
204
-
205
-
206
-
207
-
208
-
209
-
210
-
211
-
212
-
213
-
214
-
215
-
216
-
217
-
218
-
219
-
220
-
221
-
222
-
223
-
224
-
225
-
226
-
227
-
228
-
229
-
230
-
231
-
232
-
233
-
234
-
235
-
236
-
237
-
238
-
239
-
240
-
241
-
242
-
243
-
244
-
245
-
246
-
247
-
248
-
249
-
250
-
251
-
252
-
253
-
254
-
255
-
256
-
257
-
258
-
259
-
260
-
261
-
262
-
263
-
264
-
265
-
266
 |
 |

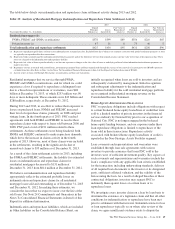
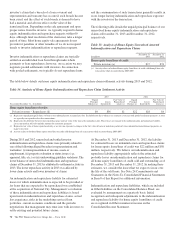
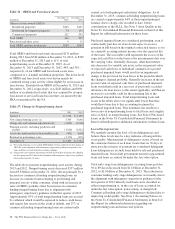
Table 35: Nonperforming Assets By Type
In millions
December 31
2013
December 31
2012
Nonperforming loans
Commercial lending
Commercial
Retail/wholesale trade $57 $61
Manufacturing 58 73
Service providers 108 124
Real estate related (a) 124 178
Financial services 79
Health care 19 25
Other industries 84 120
Total commercial 457 590
Commercial real estate
Real estate projects (b) 436 654
Commercial mortgage 82 153
Total commercial real estate 518 807
Equipment lease financing 513
Total commercial lending 980 1,410
Consumer lending (c)
Home equity (d) 1,139 951
Residential real estate
Residential mortgage (d) 890 824
Residential construction 14 21
Credit card 45
Other consumer (d) 61 43
Total consumer lending 2,108 1,844
Total nonperforming loans (e) 3,088 3,254
OREO and foreclosed assets
Other real estate owned (OREO) (f) 360 507
Foreclosed and other assets 933
Total OREO and foreclosed assets 369 540
Total nonperforming assets $3,457 $3,794
Amount of commercial lending nonperforming loans contractually current as to remaining principal and interest $ 266 $ 342
Percentage of total commercial lending nonperforming loans 27% 24%
Amount of TDRs included in nonperforming loans $1,511 $1,589
Percentage of total nonperforming loans 49% 49%
Nonperforming loans to total loans 1.58% 1.75%
Nonperforming assets to total loans, OREO and foreclosed assets 1.76 2.04
Nonperforming assets to total assets 1.08 1.24
Allowance for loan and lease losses to total nonperforming loans (g) 117 124
(a) Includes loans related to customers in the real estate and construction industries.
(b) Includes both construction loans and intermediate financing for projects.
(c) Excludes most consumer loans and lines of credit, not secured by residential real estate, which are charged off after 120 to 180 days past due and are not placed on nonperforming
status.
(d) Pursuant to alignment with interagency supervisory guidance on practices for loans and lines of credit related to consumer lending in the first quarter of 2013, nonperforming home
equity loans increased $214 million, nonperforming residential mortgage loans increased $187 million and nonperforming other consumer loans increased $25 million. Charge-offs
were taken on these loans where the fair value less costs to sell the collateral was less than the recorded investment of the loan and were $134 million.
(e) Nonperforming loans exclude certain government insured or guaranteed loans, loans held for sale, loans accounted for under the fair value option and purchased impaired loans.
(f) OREO excludes $245 million and $380 million at December 31, 2013 and December 31, 2012, respectively, related to residential real estate that was acquired by us upon foreclosure
of serviced loans because they are insured by the FHA or guaranteed by the VA.
(g) The allowance for loan and lease losses includes impairment reserves attributable to purchased impaired loans. See Note 7 Allowances for Loan and Lease Losses and Unfunded Loan
Commitments and Letters of Credit in the Notes To Consolidated Financial Statements in Item 8 of this Report for additional information.
The PNC Financial Services Group, Inc. – Form 10-K 75